Fig. 6.
Download original image
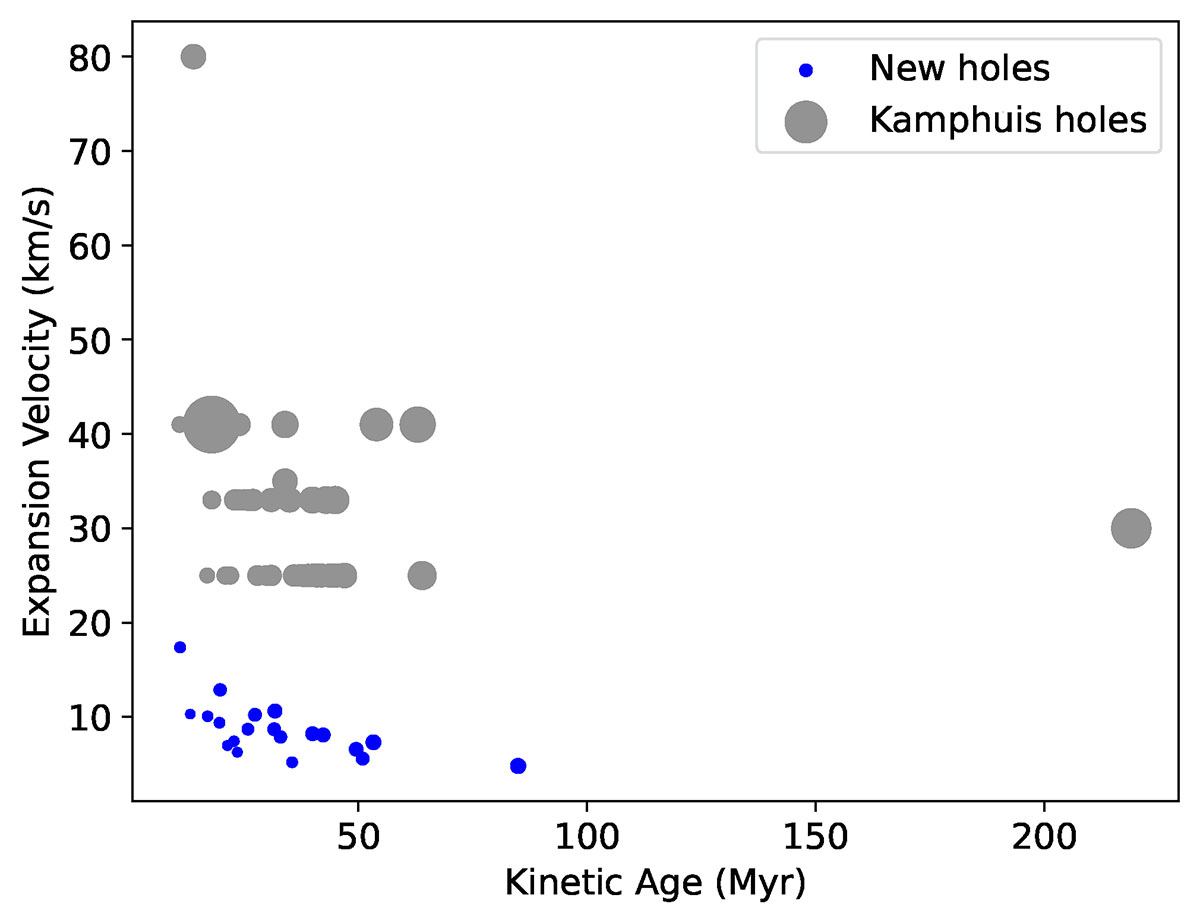
Expansion velocities of the new and old holes plotted against their kinetic age. The size of any symbol is proportional to the diameter of the H I hole it represents. Even if their sizes are bigger, the relatively higher expansion velocities of the K93 sample holes push them to lie within a younger age area of the plot. The slower expansion velocities, close to the local H I velocity dispersion (∼10 km s−1), render the kinetic age of the new sample very similar to that of the old.
Current usage metrics show cumulative count of Article Views (full-text article views including HTML views, PDF and ePub downloads, according to the available data) and Abstracts Views on Vision4Press platform.
Data correspond to usage on the plateform after 2015. The current usage metrics is available 48-96 hours after online publication and is updated daily on week days.
Initial download of the metrics may take a while.