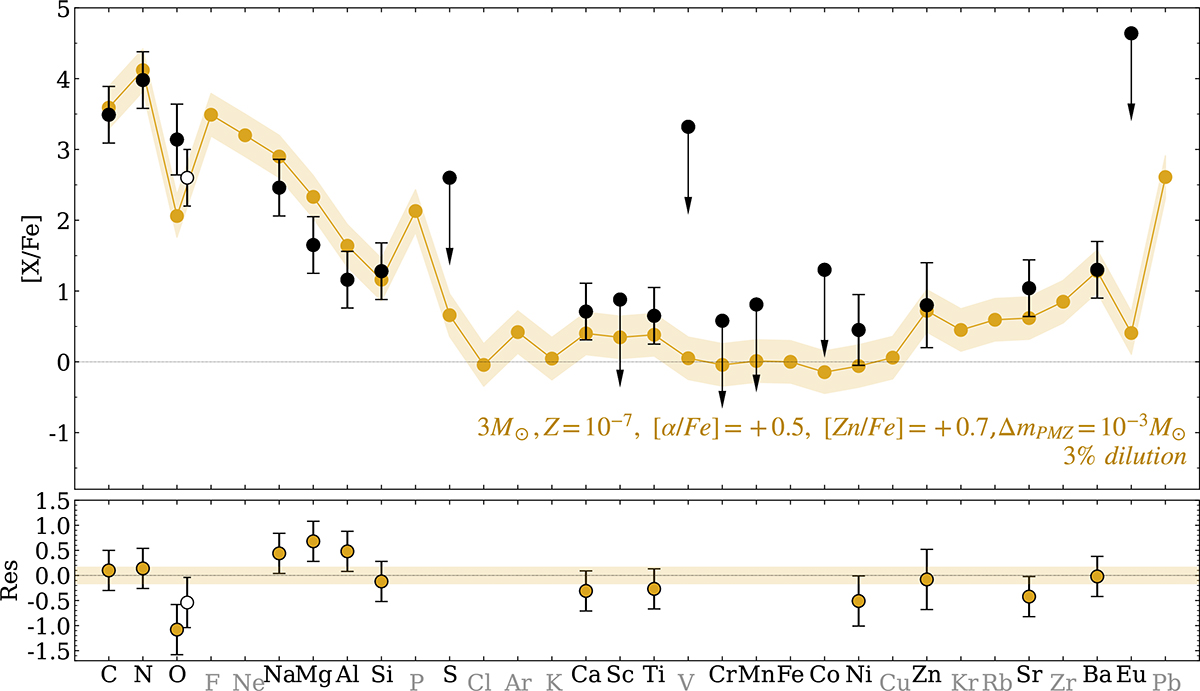
Fig. 2.
Download original image
Upper panel: Diluted yield abundances from the 3 M⊙ model with ΔmPMZ = 10−3 (gold), observed abundances (black), and upper limits (grey). Error bars are 2σ. Colour shadings represent the approximate ±0.3 dex uncertainty associated with abundances in stellar models (see the main text and Appendix A.4 for details). We show two determinations for O (solid circle from Ezzeddine et al. 2019 and open circle from Frebel et al. 2006), to highlight the uncertainty in measuring this element. Elements for which observations are unavailable are labelled in grey. Observed abundances are compiled from the literature; most are from Table 1 in Ezzeddine et al. 2019, which incorporates the 3D values from Frebel et al. 2008. Abundances for Si and Fe are from Ezzeddine & Frebel 2018. The upper limit for S is from Bonifacio et al. (2012), and V and Cr from Frebel et al. (2008). Lower panel: Residuals from the comparison.
Current usage metrics show cumulative count of Article Views (full-text article views including HTML views, PDF and ePub downloads, according to the available data) and Abstracts Views on Vision4Press platform.
Data correspond to usage on the plateform after 2015. The current usage metrics is available 48-96 hours after online publication and is updated daily on week days.
Initial download of the metrics may take a while.