Fig. 3.
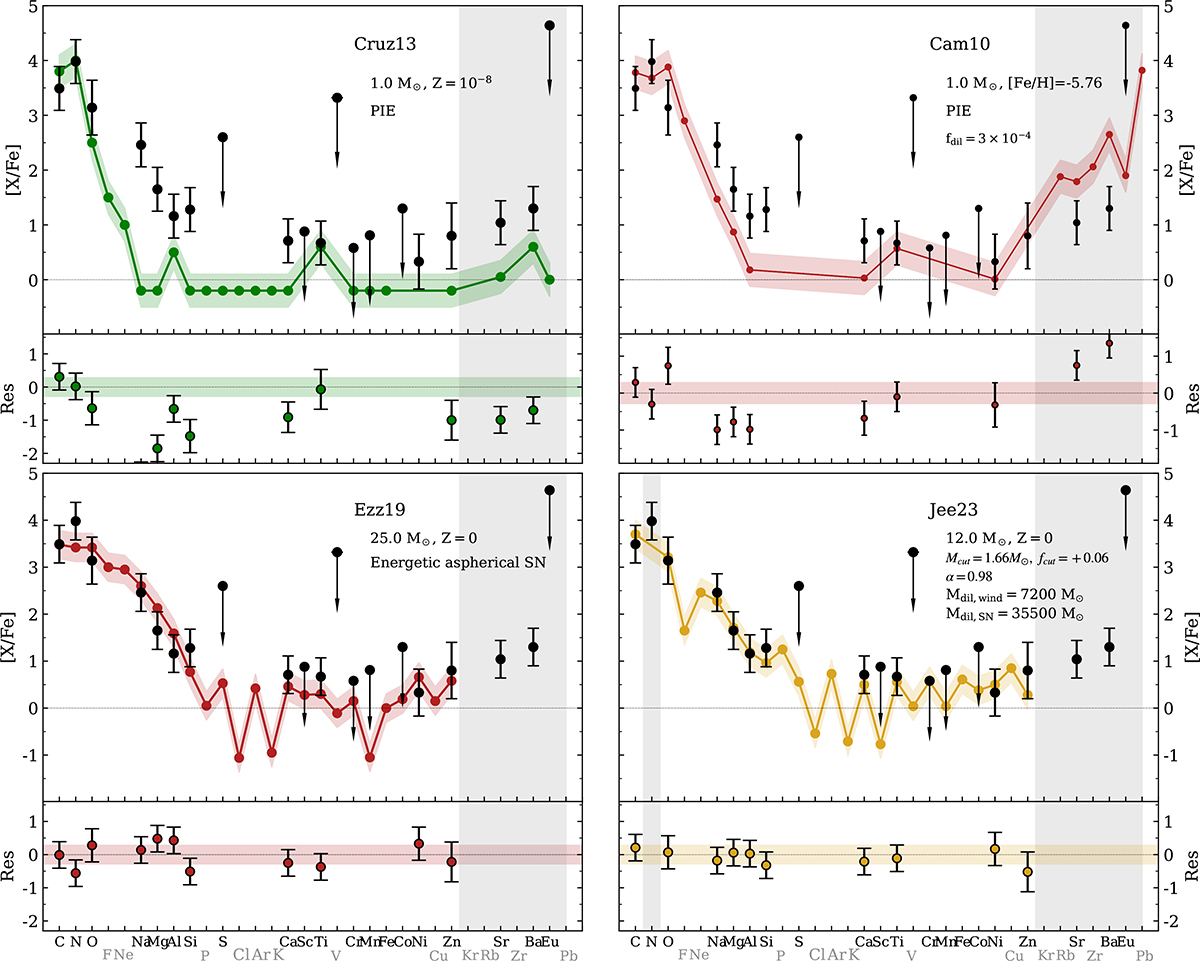
Download original image
Observed abundances of HE 1327 and observational upper limits (black) together with the yield abundances from different stellar models. Upper panels: Results from 1 M⊙ models undergoing PIEs. Lower panels: Results from massive star models undergoing SN explosions. The Z = 10−8 model (upper left) is from Cruz et al. (2013). The [Fe/H] = −5.76 (upper right) is from Campbell et al. (2010). The yields from Ezzeddine et al. (2019, lower-left panel) are from a primordial 25 M⊙ star undergoing an asymmetric mixing and fallback SN explosion. The yields from Jeena et al. (2023, lower-right panel) correspond to a rapidly rotating 12 M⊙ star of Z = 0 undergoing very efficient mixing and quasi-chemically homogeneous evolution prior to a SN explosion. The grey-shaded areas highlight the elements for which no theoretical abundances were reported. Note that in the model by Jeena et al. 2023, the authors did not consider the C and N abundances separately but instead summed them and plotted the resulting value at the location of C. We added the grey bar at the location of N to note this. As in Fig. 2, error bars are 2σ, and the shading has the same meaning. We present two determinations for O (solid circle from Ezzeddine et al. 2019 and open circle from Frebel et al. 2006) to illustrate the measurement uncertainty for this element. Observed abundances are compiled from the literature; most are from Table 1 in Ezzeddine et al. 2019, which incorporates the 3D values from Frebel et al. 2008. Abundances for Si and Fe are from Ezzeddine & Frebel 2018. The upper limit for S is from Bonifacio et al. (2012), and V and Cr from Frebel et al. (2008). Lower panel: Residuals from the comparison. The χ2 values are given in Table A.1.
Current usage metrics show cumulative count of Article Views (full-text article views including HTML views, PDF and ePub downloads, according to the available data) and Abstracts Views on Vision4Press platform.
Data correspond to usage on the plateform after 2015. The current usage metrics is available 48-96 hours after online publication and is updated daily on week days.
Initial download of the metrics may take a while.