Fig. 4.
Download original image
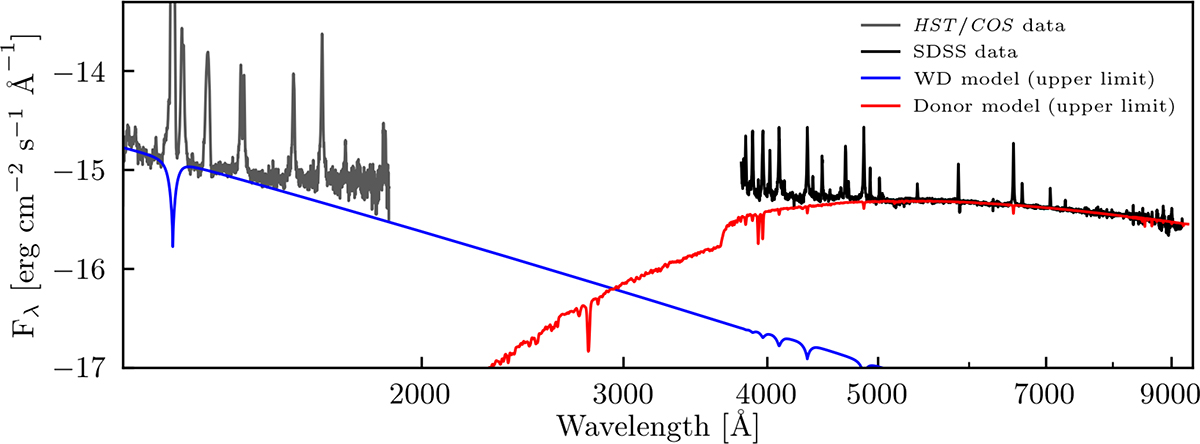
Spectral energy distribution of V479 And comprised of the HST/COS ultraviolet spectrum (dark grey) and the SDSS optical spectrum (black). In blue and red are shown the upper limits for a white dwarf and a main-sequence star, respectively (see Section 3.2). The donor’s model assumes a distance of 1850 pc. The white dwarf model is scaled to the same distance, and both are plotted on an absolute flux scale.
Current usage metrics show cumulative count of Article Views (full-text article views including HTML views, PDF and ePub downloads, according to the available data) and Abstracts Views on Vision4Press platform.
Data correspond to usage on the plateform after 2015. The current usage metrics is available 48-96 hours after online publication and is updated daily on week days.
Initial download of the metrics may take a while.