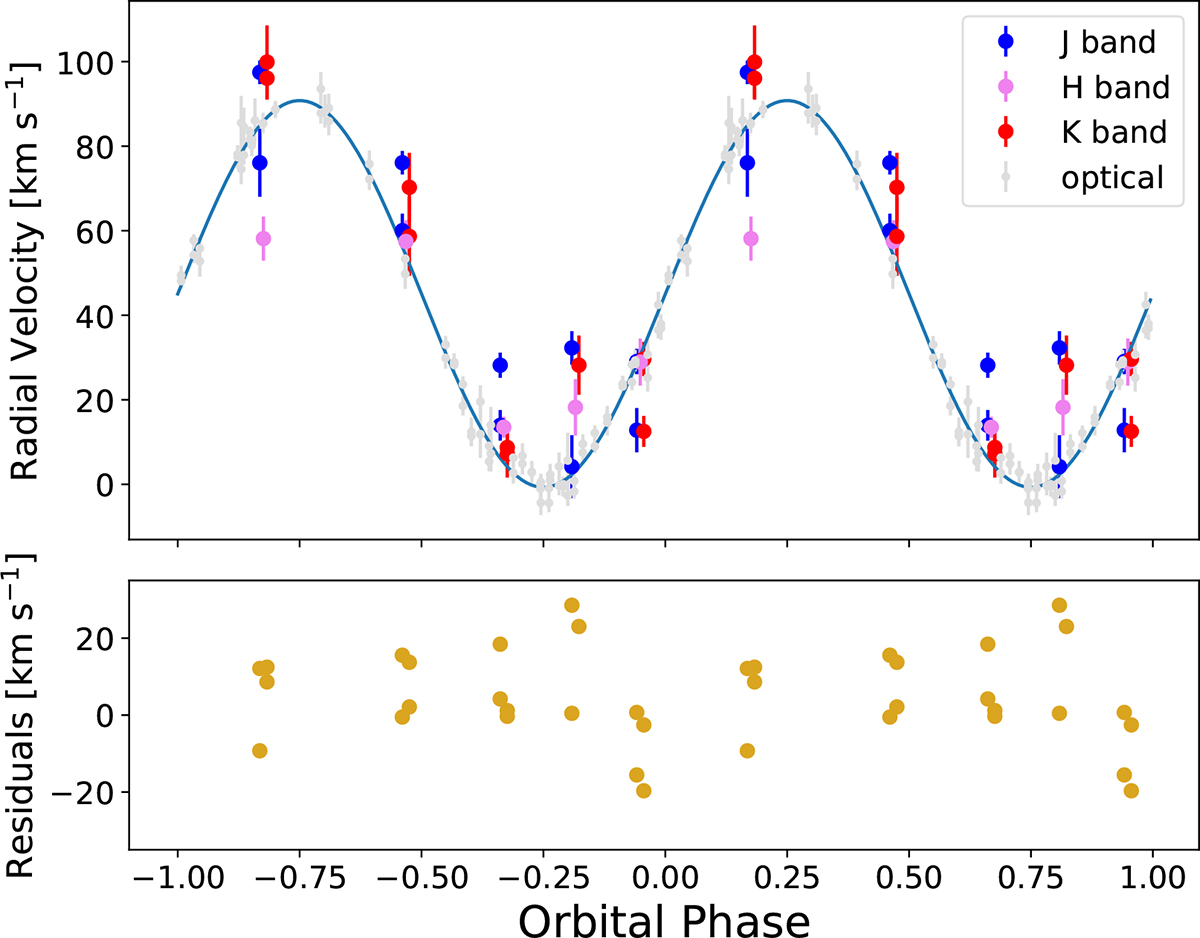
Fig. 5.
Download original image
Radial velocities measured from a complex of absorption lines in the J (blue), H (magenta), and K (red) bands of V1082 Sgr spectra. The curve fits the radial velocities obtained from high-resolution optical data shown as light-gray points in the upper panel. The residuals of J and K measurements from the radial velocity curve obtained from optical data are presented in the bottom panel.
Current usage metrics show cumulative count of Article Views (full-text article views including HTML views, PDF and ePub downloads, according to the available data) and Abstracts Views on Vision4Press platform.
Data correspond to usage on the plateform after 2015. The current usage metrics is available 48-96 hours after online publication and is updated daily on week days.
Initial download of the metrics may take a while.