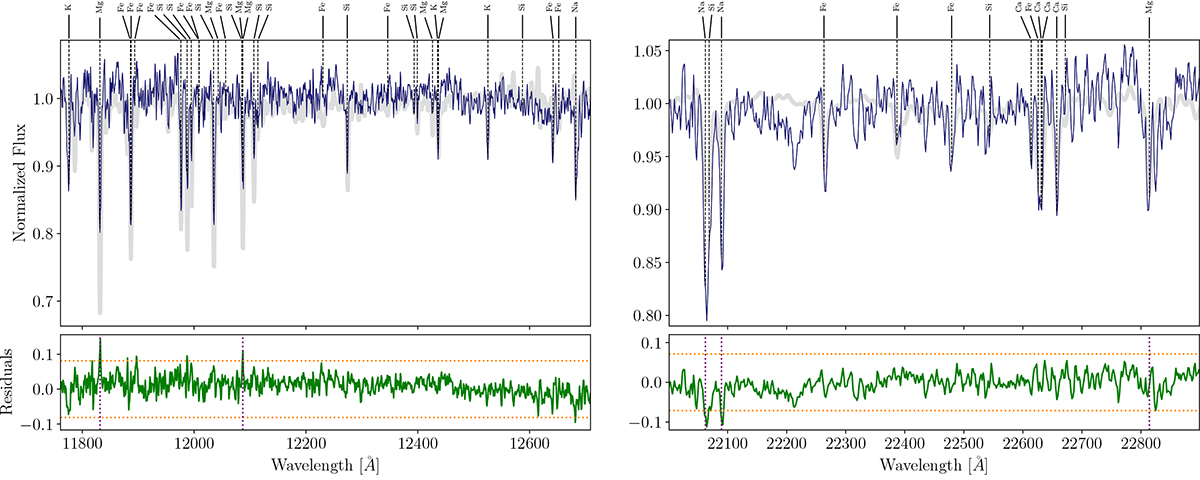
Fig. 7.
Download original image
Portions of the IR spectra of V1082 Sgr, emphasizing spectral lines in discordance with the corresponding standards, are presented in the upper panel. The residuals between the observed normalized spectrum and a K2 V type standard are shown in the bottom panels. Horizontal dotted orange lines mark the 3σ deviation level. Vertical dotted lines mark the deviating lines.
Current usage metrics show cumulative count of Article Views (full-text article views including HTML views, PDF and ePub downloads, according to the available data) and Abstracts Views on Vision4Press platform.
Data correspond to usage on the plateform after 2015. The current usage metrics is available 48-96 hours after online publication and is updated daily on week days.
Initial download of the metrics may take a while.