Fig. 8.
Download original image
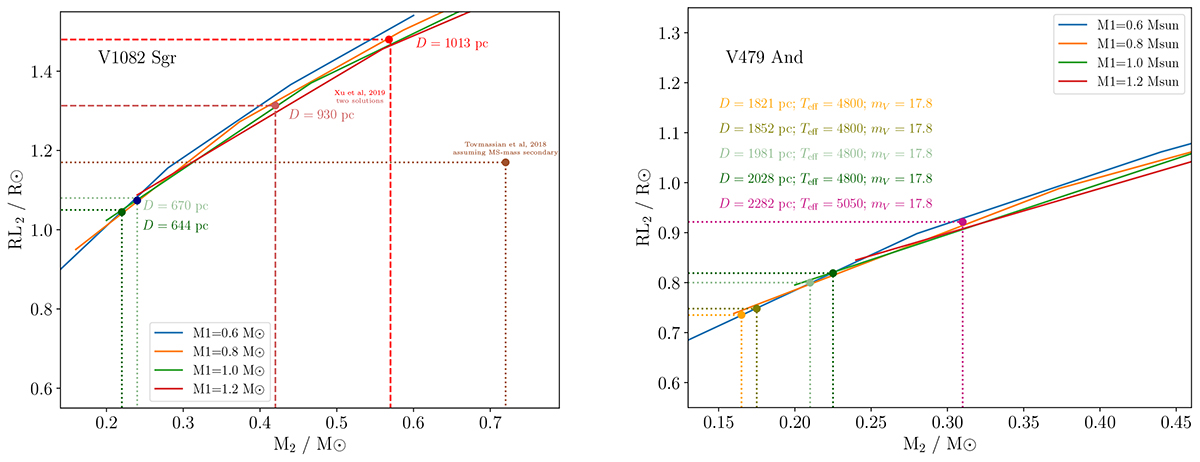
Diagnostic diagrams of the R2–M2 relation for V1082 Sgr (left) and V479 And (right), assuming that the donor star fills its Roche lobe and accounting for the revised Gaia distance ranges. The methodology is described in Sect. 4.1. Horizontal dotted lines indicate the donor star radii (assuming spherical geometry) corresponding to the spectral class Teff needed to match the observed luminosity for different distances. Vertical lines mark the inferred donor masses. In the left panel, the solutions fall within the shaded green area. In contrast, solutions from the previous studies (labeled) illustrate that they are inconsistent with the revised distances adopted in this work.
Current usage metrics show cumulative count of Article Views (full-text article views including HTML views, PDF and ePub downloads, according to the available data) and Abstracts Views on Vision4Press platform.
Data correspond to usage on the plateform after 2015. The current usage metrics is available 48-96 hours after online publication and is updated daily on week days.
Initial download of the metrics may take a while.