Fig. 2.
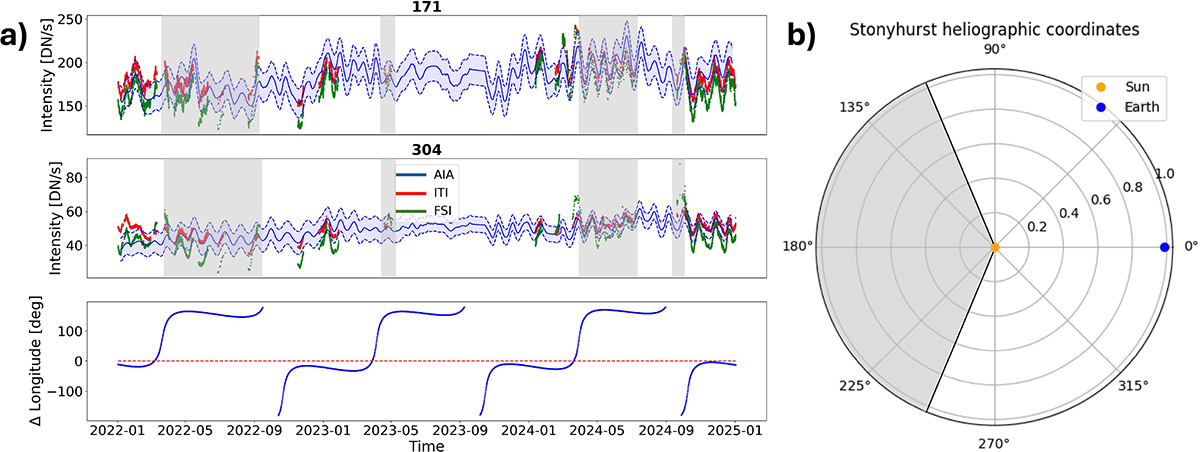
Download original image
Comparison between the light curves from January 2022 to January 2025 derived from the baseline-calibrated FSI data (green), the ITI translated data (red), and the reference AIA data (blue), including training data. The shaded-blue area corresponds to ±1σ error range from AIA. In a) the first panel corresponds to the 171 Å and the second to the 304 Å channel. The light curves were co-aligned in longitude using the separation angle between the SDO and Solar Orbiter spacecraft shown in the third panel. In b) the coordinate system is shown, with the shaded-gray area corresponding to the shaded-gray area in a), indicating that Solar Orbiter was located on the solar far side and thus not observing the same regions of the Sun as SDO.
Current usage metrics show cumulative count of Article Views (full-text article views including HTML views, PDF and ePub downloads, according to the available data) and Abstracts Views on Vision4Press platform.
Data correspond to usage on the plateform after 2015. The current usage metrics is available 48-96 hours after online publication and is updated daily on week days.
Initial download of the metrics may take a while.