Fig. 3.
Download original image
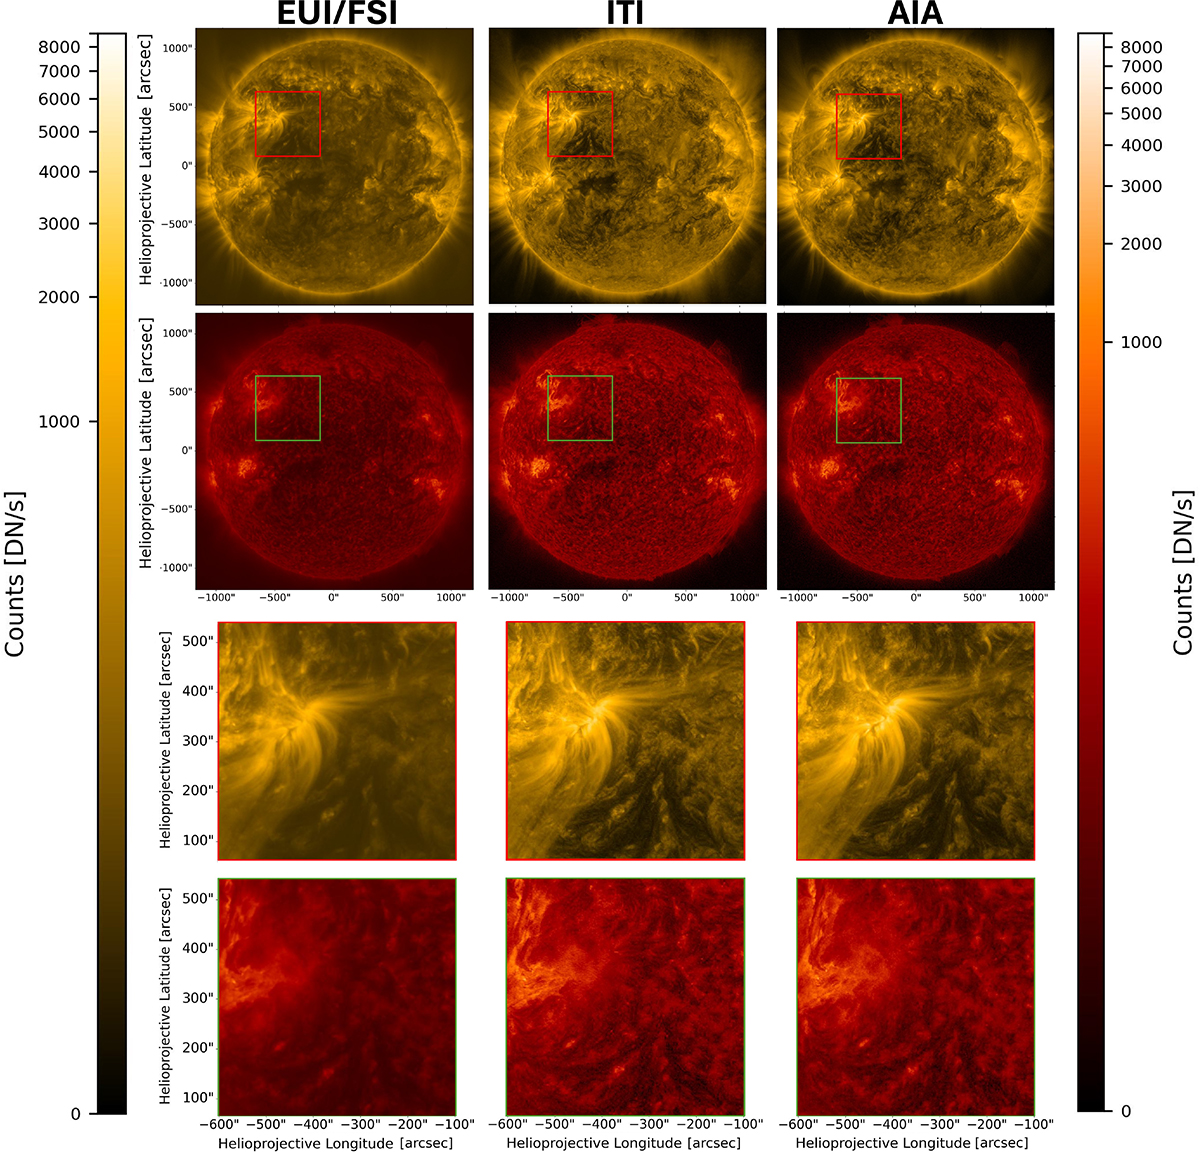
Comparison of the baseline calibration, ITI, and the reference AIA observation from March 20, 2024, at 16:00 UT. The left column shows the baseline-calibrated FSI observations in 171 Å and 304 Å. The second column corresponds to our ITI translated observations, and the third row shows the reference AIA observations. The smaller cutouts shown in the lower rows correspond to the green and red squares in the full Sun observations.
Current usage metrics show cumulative count of Article Views (full-text article views including HTML views, PDF and ePub downloads, according to the available data) and Abstracts Views on Vision4Press platform.
Data correspond to usage on the plateform after 2015. The current usage metrics is available 48-96 hours after online publication and is updated daily on week days.
Initial download of the metrics may take a while.