Open Access
Fig. B.1.
Download original image
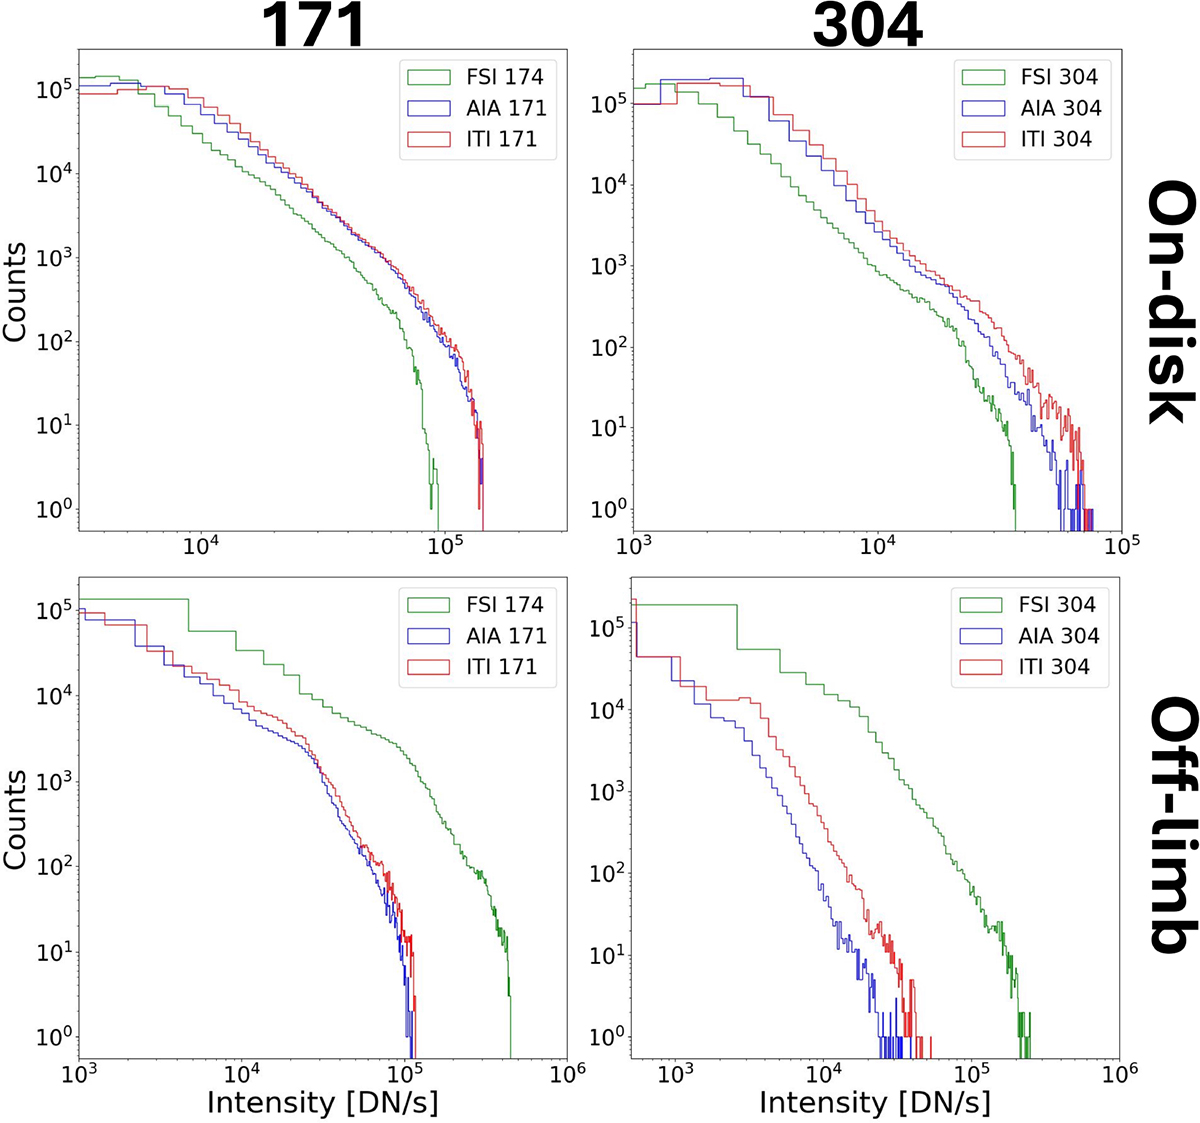
Comparison of the logarithmic intensities for AIA (blue), ITI (red), and the baseline calibrated FSI (green) over test set 1 (Earth-aligned). The first row shows the on-disk histogram, and the second row the off-limb histogram for the 171 Å and the 304 Å channel.
Current usage metrics show cumulative count of Article Views (full-text article views including HTML views, PDF and ePub downloads, according to the available data) and Abstracts Views on Vision4Press platform.
Data correspond to usage on the plateform after 2015. The current usage metrics is available 48-96 hours after online publication and is updated daily on week days.
Initial download of the metrics may take a while.