Fig. 1
Download original image
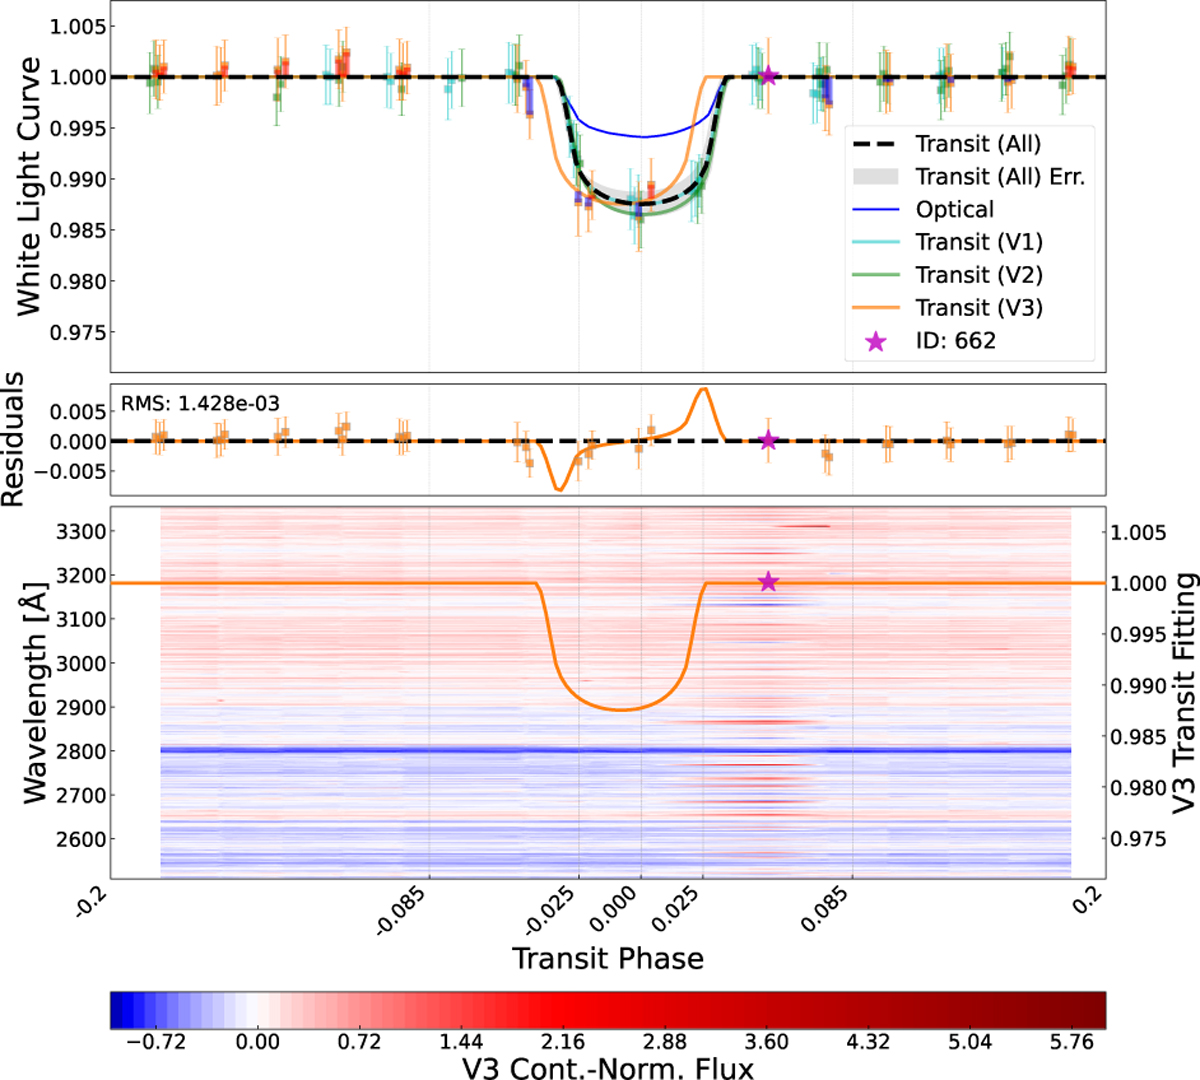
CUTE NUV transit and spectral analysis for WASP-189b. Top: White-light curves for three visits (V1, V2, and V3; coloured points) and all data combined, with best-fit transit models (dashed lines) and uncertainties (grey shading). The magenta star marks Event 662 in V3. Middle: residuals relative to best-fit models for each visit and all data, highlighting deviations in V3 (orange). Bottom: Spectral map for V3: flux as a function of wavelength and phase, normalised to the continuum/ The colour scale shows fractional deviations. Anomalous features after egress (Event 662) indicate transient variability.
Current usage metrics show cumulative count of Article Views (full-text article views including HTML views, PDF and ePub downloads, according to the available data) and Abstracts Views on Vision4Press platform.
Data correspond to usage on the plateform after 2015. The current usage metrics is available 48-96 hours after online publication and is updated daily on week days.
Initial download of the metrics may take a while.