Fig. A.1
Download original image
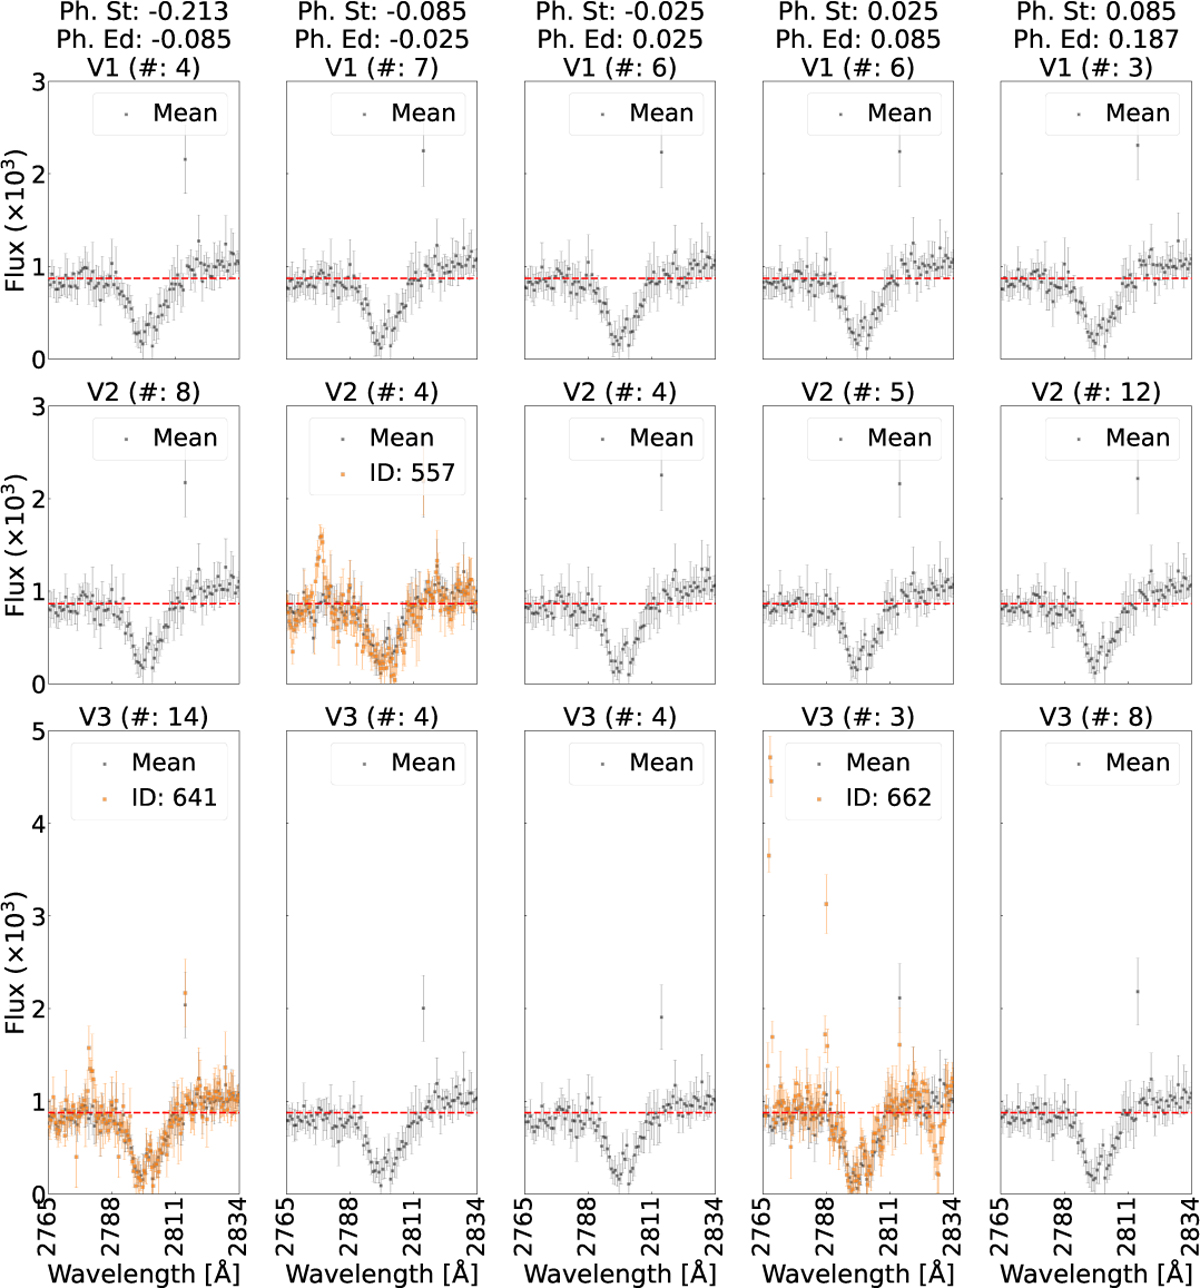
Phase-resolved spectral analysis of WASP-189 b around the Mg II region (2765.6–2834.6 Å). Each panel shows the flux variation (counts, not normalised) as a function of wavelength for different observational visits (V1, V2, and V3) and phase bins (Ph). The symbol # indicates the number of samples in each bin, while St and Ed denote the start and end phases, respectively. The grey markers represent the mean flux profile across multiple observations, with error bars indicating the standard deviation. Three specific events (557, 641, and 662) that deviate from the mean trend are highlighted in orange. The dashed red line denotes the median continuum level for each visit. These results provide insights into the temporal and phase-dependent variations in the observed spectral features, offering constraints on the atmospheric and astrophysical processes affecting WASP-189 b.
Current usage metrics show cumulative count of Article Views (full-text article views including HTML views, PDF and ePub downloads, according to the available data) and Abstracts Views on Vision4Press platform.
Data correspond to usage on the plateform after 2015. The current usage metrics is available 48-96 hours after online publication and is updated daily on week days.
Initial download of the metrics may take a while.