Fig. B.1
Download original image
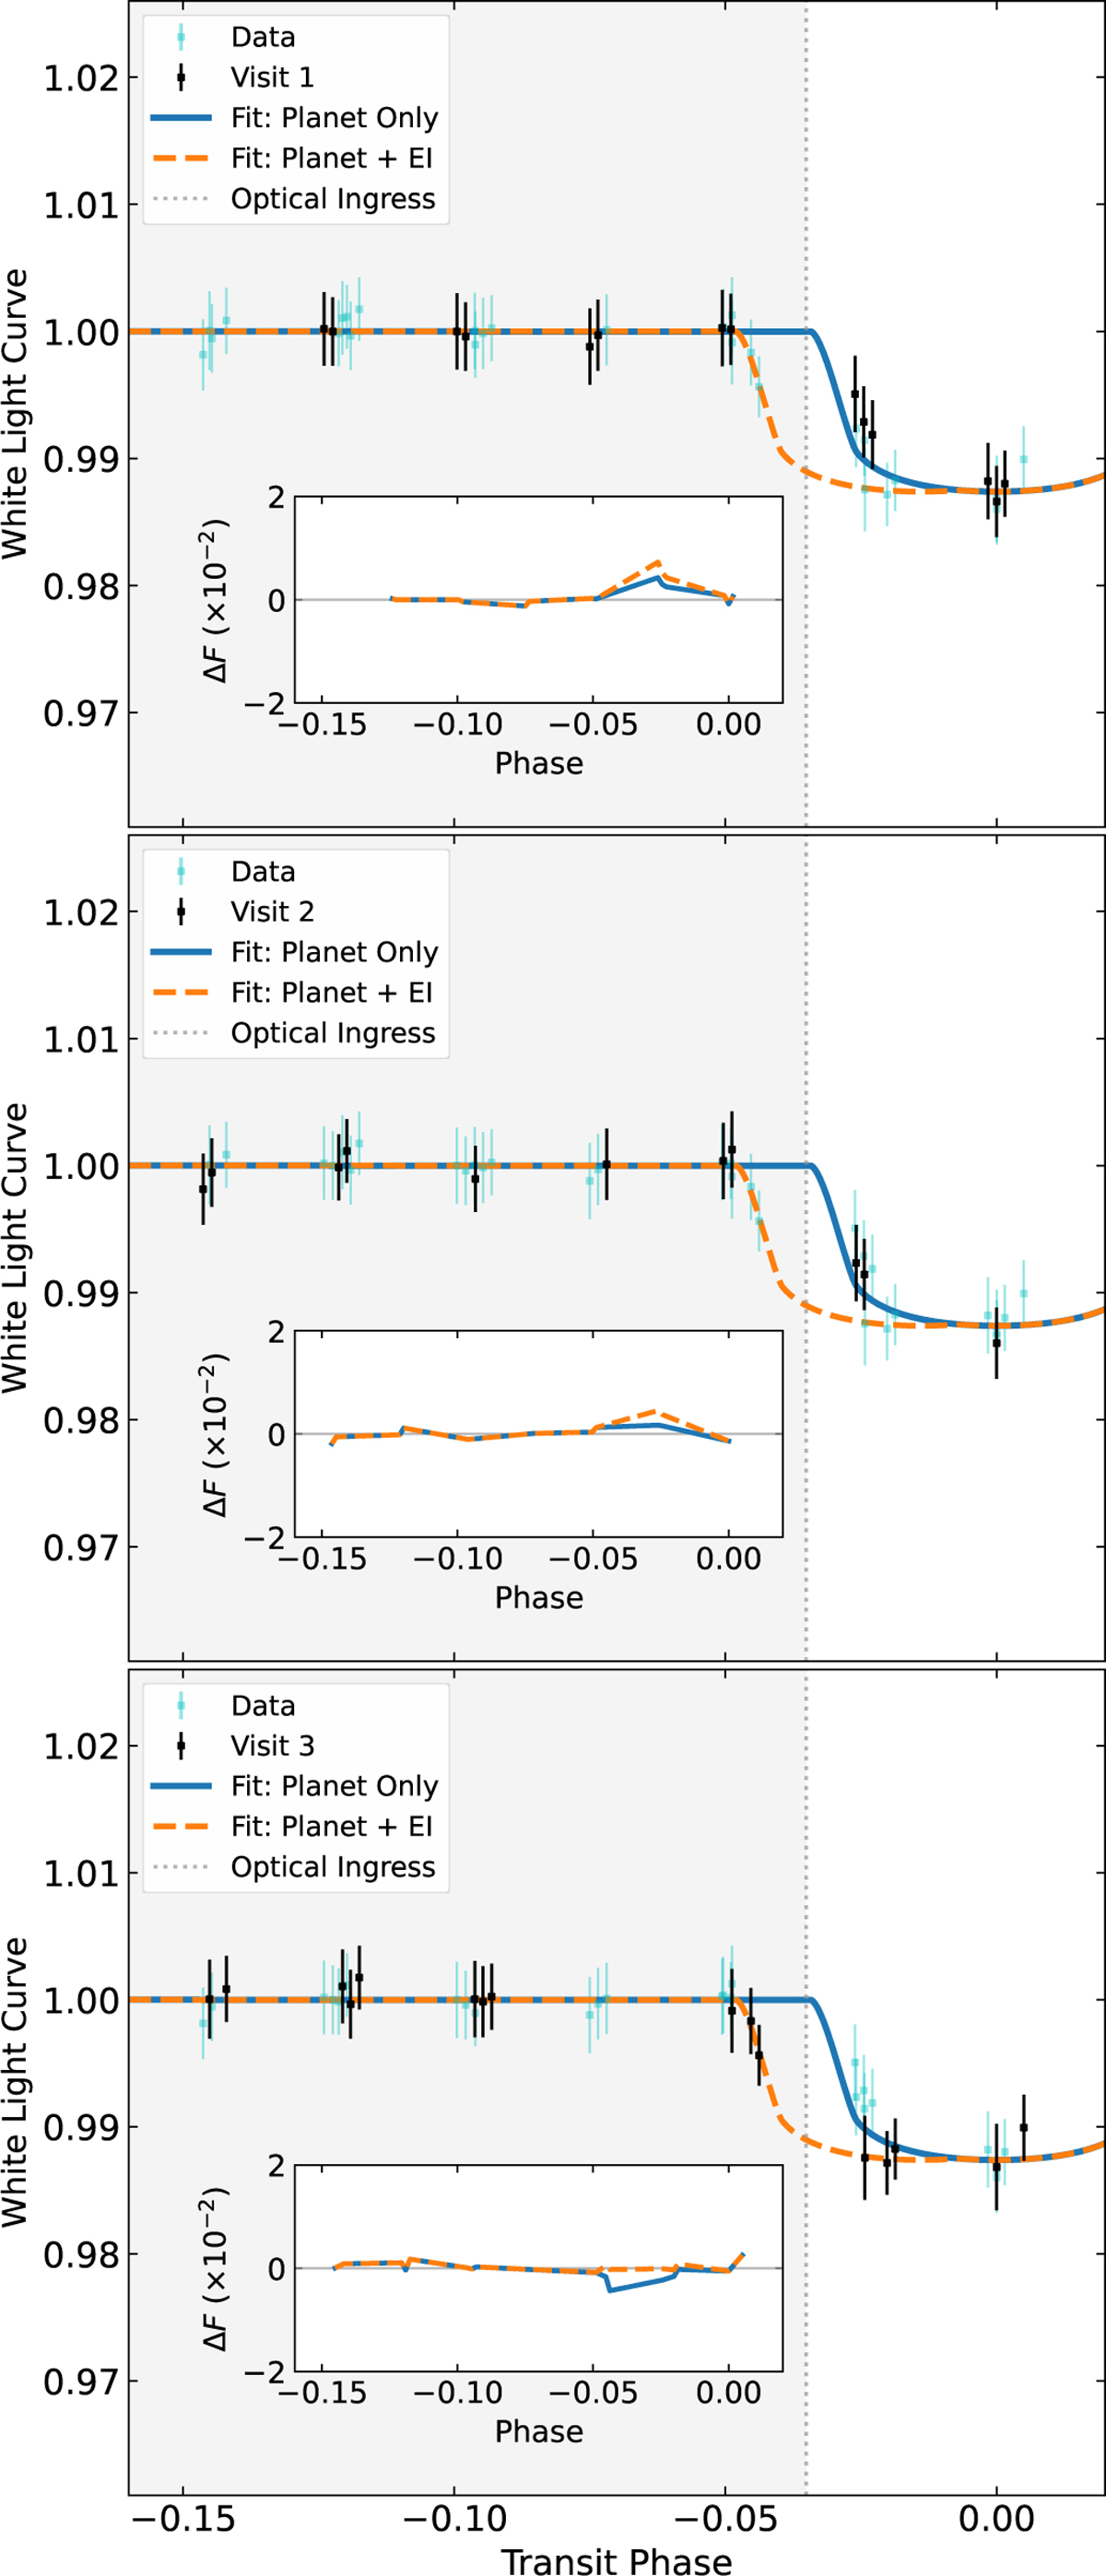
Per-visit comparison between the nominal transit model and the phase-shifted EI model. Each row corresponds to one WASP-189b transit (V1–V3). The main panels display the observed white light curves (cyan for all visits, black for the highlighted visit) together with the best-fitting models: the nominal planet-only transit (solid blue) and the planet+EI model (dashed orange). The insets show the corresponding residuals, ΔF, relative to each model. The EI model is constructed as the pointwise minimum of the base transit and a phase-shifted replica, providing a diagnostic test for the presence of an earlier ingress.
Current usage metrics show cumulative count of Article Views (full-text article views including HTML views, PDF and ePub downloads, according to the available data) and Abstracts Views on Vision4Press platform.
Data correspond to usage on the plateform after 2015. The current usage metrics is available 48-96 hours after online publication and is updated daily on week days.
Initial download of the metrics may take a while.