Fig. 11.
Download original image
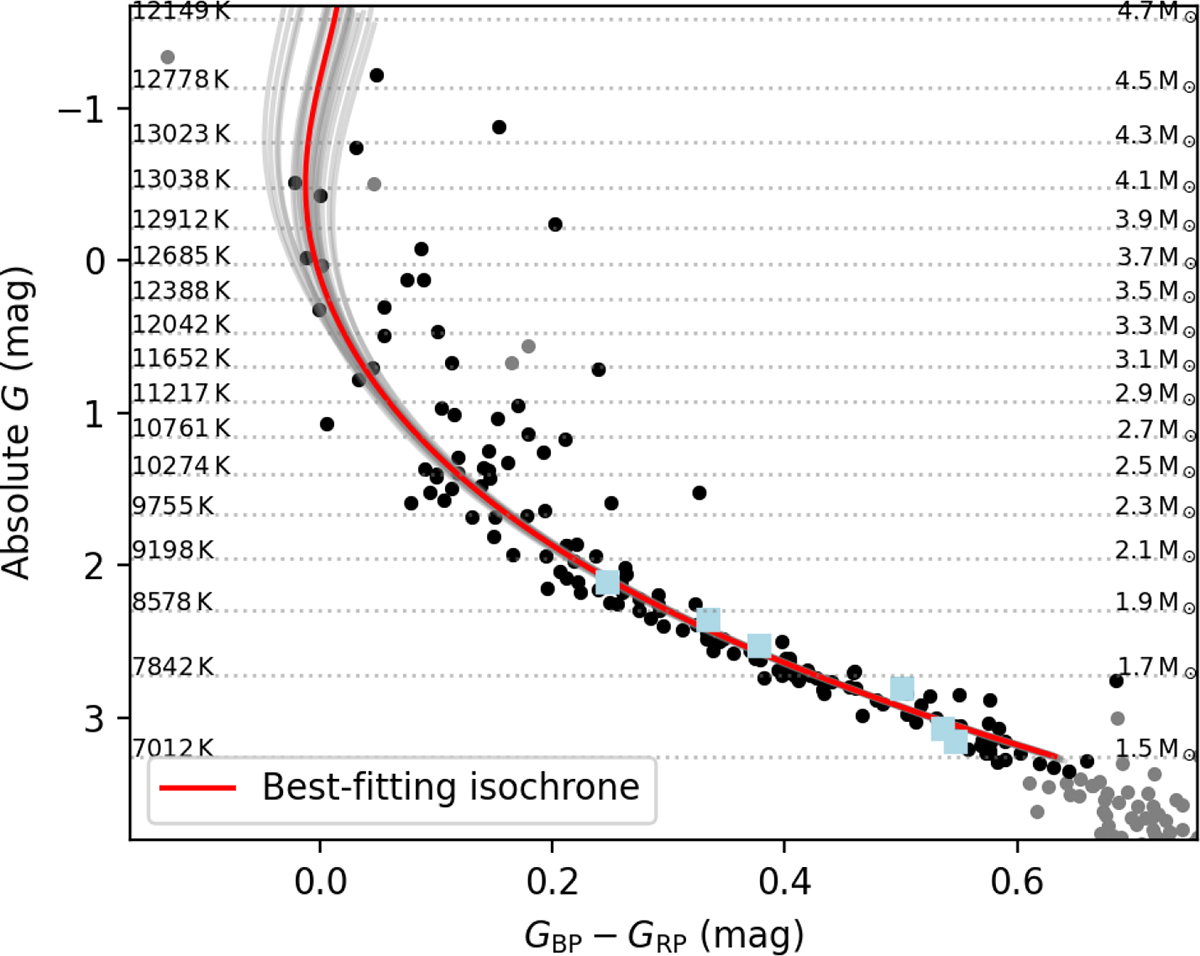
Best-fitting result of the self-constructed isochrone with η = 10, fCBM = 0.025, and vi/vi, crit = 0.5. The red curve represents the best-fitting isochrone, while the grey curves show 20 randomly selected samples from the MCMC chains, showing the uncertainty region. The small grey dots indicate member stars from Meingast et al. (2021), and the black dots are the upper main-sequence stars used as input observables. The modelled g-mode pulsators are marked with light blue squares.
Current usage metrics show cumulative count of Article Views (full-text article views including HTML views, PDF and ePub downloads, according to the available data) and Abstracts Views on Vision4Press platform.
Data correspond to usage on the plateform after 2015. The current usage metrics is available 48-96 hours after online publication and is updated daily on week days.
Initial download of the metrics may take a while.