| Issue |
A&A
Volume 703, November 2025
|
|
|---|---|---|
| Article Number | A116 | |
| Number of page(s) | 18 | |
| Section | Stellar structure and evolution | |
| DOI | https://doi.org/10.1051/0004-6361/202556409 | |
| Published online | 13 November 2025 | |
Asteroseismology of the young open cluster NGC 2516
II. Constraining cluster age using gravity-mode pulsators
1
Institute of Astronomy (IvS), Department of Physics and Astronomy, KU Leuven, Celestijnenlaan 200D, 3001 Leuven, Belgium
2
Université Paris-Saclay, Université de Paris, Sorbonne Paris Cité, CEA, CNRS, AIM, F-91191 Gif-sur-Yvette, France
3
Department of Astrophysics, IMAPP, Radboud University Nijmegen, PO Box 9010 6500 GL, Nijmegen, The Netherlands
4
Max-Planck-Institut fũr Astronomie, Königstuhl 17, D-69117 Heidelberg, Germany
⋆ Corresponding authors: This email address is being protected from spambots. You need JavaScript enabled to view it.
, This email address is being protected from spambots. You need JavaScript enabled to view it.
, This email address is being protected from spambots. You need JavaScript enabled to view it.
Received:
14
July
2025
Accepted:
4
September
2025
Abstract
Context. Although asteroseismology is regarded as the most powerful tool for probing stellar interiors, seismic modelling remains dependent on global stellar parameters such as temperature and luminosity. Stellar clusters offer direct measurements of these parameters by fitting a colour–magnitude diagram. This makes the application of asteroseismology in stellar clusters a valuable approach to advancing the entire field of stellar physics modelling.
Aims. We aimed to develop seismic modelling for gravity-mode pulsators in the open cluster NGC 2516 to determine stellar ages and investigate internal mixing processes.
Methods. We computed 1D stellar evolutionary models using the code called modules for experiments in stellar astrophysics (MESA), which incorporates rotation-induced transport processes. Exponential overshooting in the transition layers between convective and radiative regions was included, and rotation-induced mixing in the radiative envelope. Grids of evolutionary models that covered isochrone-derived mass ranges were computed. The models were evolved up to 300 Myr because of the young age of the cluster (∼100 Myr).
Results. By fitting the frequencies of identified modes of four gravity-mode member pulsators simultaneously, we measured the seismic age of cluster NGC 2516 as 132 ± 8 Myr. This high-precision seismic age estimate deviates by 1σ from the isochronal age derived from public MESA isochrones and stellar tracks (MIST) isochrones for rotating stars. Our findings show that seismic modelling strongly constrains core overshooting, but because the period spacing patterns are smooth, it provides weak constraints on mixing in the radiative envelope of young gravity-mode pulsators. The two most massive gravity-mode pulsators have MIST masses of ∼2.0 M⊙ while their seismic masses are ∼1.75 M⊙. We constructed new asteroseismology-calibrated isochrones using input physics identical to that of our seismic model grid. While this resolved the age discrepancy, the mass discrepancy is only partially addressed. The remaining small but persisting mass discrepancy implies a mismatch between the physics in core to surface environments of 1D stellar models and the seismic observables probing these areas of fast-rotating stars.
Key words: asteroseismology / stars: early-type / stars: interiors / stars: oscillations / stars: rotation / galaxies: clusters: individual: NGC 2516
© The Authors 2025
 Open Access article, published by EDP Sciences, under the terms of the Creative Commons Attribution License (https://creativecommons.org/licenses/by/4.0), which permits unrestricted use, distribution, and reproduction in any medium, provided the original work is properly cited.
This article is published in open access under the Subscribe to Open model. This email address is being protected from spambots. You need JavaScript enabled to view it. to support open access publication.
1. Introduction
Although one-dimensional (1D) stellar models have achieved significant success, substantial uncertainties remain in modern stellar evolutionary modelling. One of the major concerns is stellar rotation (Maeder 2009). Rotation plays an important role in modifying the thermal equilibrium and internal physics of a star, especially in fast-rotating early-type stars (von Zeipel 1924; Heger et al. 2005). Modelling fast-rotating stars should be considered a 2D problem at least (symmetric about the rotation axis), which might be sophisticated and time-consuming. Recently, 2D stellar evolution models have been achieved for rapidly-rotating B-type stars deformed by the centrifugal force by Mombarg et al. (2023, 2024a), building on the foundation of steady-state models computed with the ESTER code (Espinosa Lara & Rieutord 2011; Rieutord et al. 2016).
In contrast to these 2D evolutionary computations, hydrodynamical simulations covering multiple dynamical timescales have been achieved in two and three dimensions for various masses and evolutionary stages. Their purpose was to simulate angular momentum (AM) transport and chemical mixing by internal gravity waves in intermediate-mass stars (see the series of papers by Edelmann et al. 2019; Horst et al. 2020; Varghese et al. 2023; Ratnasingam et al. 2023; Vanon et al. 2023; Herwig et al. 2023; Thompson et al. 2024; Varghese et al. 2024; Rogers & Ratnasingam 2025). However, such sophisticated simulations cannot be done to cover the entire life of a star. A more time-efficient way to model rotating stars is to accept some extent 1D approximations and simplifications of reality, such as the shellular approximation of rotation and a diffusive approximation of the transport processes (Endal & Sofia 1978; Meynet & Maeder 1997; Heger et al. 2000, 2005). This approach ignores meridional circulation and advective motions in general (Eggenberger et al. 2008; Potter et al. 2012). These simplifications are applied in the code modules for experiments in stellar astrophysics (MESA, Paxton et al. 2011, 2013, 2015; Paxton et al. 2018, 2019; Jermyn et al. 2023). Even in the case of more complex rotation-induced advective motions and other induced magnetic phenomena, 1D formulae for the transport processes can be adopted (e.g. Zahn 1992; Meynet & Maeder 1997; Heger et al. 2000; Spruit 2002; Ekström et al. 2012; Lagarde et al. 2012; Georgy et al. 2013; Fuller et al. 2019; Eggenberger et al. 2022).
Asteroseismology is the study of oscillation modes or waves that travel inside stars (Aerts et al. 2010). It has become a unique and powerful way to study stellar internal structures. The capacity of asteroseismology to probe stellar physics is being exploited in two ways. First, observed stellar oscillation signals carry information about the internal stellar environment, such as chemical (Pedersen et al. 2018) and temperature gradients (Michielsen et al. 2021). This allows us to estimate core overshooting (Mombarg et al. 2021), near-core rotation (Van Reeth et al. 2016; Li et al. 2020b), envelope mixing profiles (Michielsen et al. 2019; Pedersen et al. 2021), and magnetic fields (Li et al. 2022, 2023; Deheuvels et al. 2023; Hatt et al. 2024). Second, we can constrain and calibrate some of the parametrised internal profiles used in 1D models with seismic signals. For example, the angular momentum transport has been studied and calibrated using gravity-mode oscillations in A- and F-type main-sequence stars (known as γ Doradus (γ Dor) stars, Kaye et al. 1999; Ouazzani et al. 2019; Mombarg 2023; Moyano et al. 2023; Mombarg et al. 2024a). The current paper focuses on these intermediate-mass γ Dor pulsators.
Asteroseismic modelling of γ Dor stars is a high-dimensional fitting problem (Aerts et al. 2018) and therefore relies heavily on additional (non-seismic) constraints to lift degeneracies. Spectroscopic observations are necessary, but the parameters derived from the spectra (effective temperature, luminosity, and surface gravity) provide only loose constraints on stellar evolutionary stages, because their uncertainties are comparable to the location changes caused by stellar evolution during the main sequence. As a result, attention turned to multiple systems, and binary stars become the primary focus (e.g. Huber 2015; Murphy 2025). Current modelling of eclipsing binaries can achieve uncertainties as low as 0.2% in masses and radii (e.g. Maxted et al. 2020). Many γ Dor-type components have been found in binary systems (e.g. Schmid et al. 2015; Keen et al. 2015; Li et al. 2020a; Sekaran et al. 2020), and asteroseismic binary modelling work has been achieved for a handful of systems, showing the great power of binary-asteroseismology as a performant synergistic approach (e.g. Schmid & Aerts 2016; Guo et al. 2017, 2019; Zhang et al. 2018; Johnston et al. 2019b; Sekaran et al. 2020, 2021; Kemp et al. 2025). Beyond the constraints on masses and radii, some studies also highlighted the contribution of the evolutionary stage, by noting that the two pulsating stars in a binary system should share the same age (e.g. Schmid & Aerts 2016; Johnston et al. 2019b). For example, Schmid & Aerts (2016) required the two γ Dor components to have the same age when modelling KIC 10080943. It is noteworthy that some modelling studies of evolved solar-like oscillators in binary systems have also demonstrated age consistency between the two oscillating components (e.g. Metcalfe et al. 2015; White et al. 2017; Li et al. 2018). The equal-age assumption and the mass and radius constraints provided by binary systems greatly facilitate the asteroseismic models.
Not only binary systems, but also stellar clusters provide additional constraints for asteroseismic modelling. Stellar parameters of member stars in clusters can be measured using the colour–magnitude diagram (CMD), because they share nearly the same distance, age, and initial metallicity. Several studies have identified pulsating stars in clusters. High-precision asteroseismology has been developed for the four open clusters in the Kepler field (NGC 6866, 6819, 6791, 6811, see e.g.: Corsaro et al. 2012; Balona et al. 2013), and for M67 and M4 in the K2 field (Miglio et al. 2016; Stello et al. 2016b). More recently, the young open clusters UBC-1, Pleiades, and NGC 2516 in the TESS1 continuous viewing zone were scrutinised observationally (Fritzewski et al. 2024; Bedding et al. 2023; Li et al. 2024), and some stellar associations (Kerr et al. 2022b,a) and star-forming complexes (Murphy et al. 2024). Asteroseismic modelling efforts in clusters have mainly focused on solar-like oscillators, including M67 (Reyes et al. 2025), M4 (Tailo et al. 2022), NGC 6866 by Brogaard et al. (2023), and more (see Tayar & Joyce 2025). These studies have revealed some discrepancies in age and mass estimates compared to isochrone fitting results, which rely on precomputed stellar models to fit the stars in the CMD without taking asteroseismic input into account. Modelling of young open clusters using pulsating main-sequence stars remains scarce.
We present the first joint asteroseismic modelling of main-sequence gravity-mode pulsators in a young open cluster. The structure of the paper is as follows. Section 2 introduces previous pilot studies of pulsating stars in the open cluster NGC 2516, and the observational constraints on the member stars derived from the best-fitting isochrone in the CMD. Section 3 describes the input physics we adopted in our asteroseismic modelling, the construction of our new model grid, and the search for the best-fitting models. We applied two approaches. First, we allow the stars to have independent ages. In the second instance, we enforced a common age for all considered pulsators. In Section 4 we present our results from the two approaches and report discrepancies in age and mass from different methods. To address these discrepancies, we constructed novel asteroseismology-calibrated isochrones in Section 5. We demonstrate that the asteroseismology-calibrated isochrone solves the age discrepancy, but it does not resolve a modest remaining mass discrepancy. Our conclusions are given in Section 6.
2. The sample and observational constraints
Li et al. (2024) studied the photometric variability of member stars in the open cluster NGC 2516. In total, 24 stars were found to exhibit gravity-mode (g-mode) pulsations. These stars include γ Dor stars at the low-temperature end (with Teff ∼ 7000 K Balona et al. 1994; Kaye et al. 1999; Dupret et al. 2005), slowly pulsating B-type (SPB) stars (Waelkens 1991; De Cat & Aerts 2002), and some g-mode pulsators that appear between the blue edge of theoretical instability strips (IS) of γ Dor stars and the red edge of the IS of SPB stars (Dupret et al. 2005; Szewczuk & Daszyńska-Daszkiewicz 2017), which have been noted both in pre-Gaia ground-based photometry and by the Gaia mission (Mowlavi et al. 2013; Gaia Collaboration 2023; Mombarg et al. 2024b). Considering the similarities in observational properties and internal physical mechanisms among these variable stars, we collectively refer to them as g-mode pulsators, without further subclassification based on spectral type.
Among the 24 g-mode pulsators in NGC 2516, 11 show clear period spacing patterns. These patterns refer to the period differences (ΔP = Pn + 1, l, m − Pn, l, m) between consecutive modes (Pn, l, m) with the same angular degree l and azimuthal order m, but with radial orders n differing by ±1. In fact, if the period-spacing pattern is interrupted, we can also fit the periods themselves instead of the period spacings as discussed in great detail by Michielsen et al.(2021). The presence of these clear period spacing patterns enables us to model the g-mode pulsators in more detail.
We selected our sample for seismic modelling based on the results of Li et al. (2024). Although 11 g-mode stars exhibit clear period spacing patterns, not all of them are equally suitable for forward modelling, as some deviate from the best-fitting isochrone. These deviations may be caused by binarity, which introduces systematic deviations in the determination of stellar parameters such as effective temperature, luminosity, and mass. Therefore, we selected only six stars that lay exactly on the best-fitting isochrone, as listed in Table 1.
Isochrone-derived observational constraints for the effective temperatures, luminosities, and masses of the six γ Dor stars in NGC 2516.
Li et al. (2024) used the MIST isochrones (MESA Isochrones and Stellar Tracks, Dotter 2016; Choi et al. 2016) to fit the colour–magnitude diagram (CMD) of NGC 2516 and derived age and extinction. They tested different rotation rates and found that the slower-rotating isochrones provided the best fit, as they resulted in the smallest residuals. Following their work, we derived the effective temperatures, luminosities, and masses of the six selected g-mode pulsators from their best-fitting MIST isochrone. The values for these three quantities of the six pulsators then form the basis for constructing the model grid and serve as observational constraints in our subsequent modelling. The results are presented in Table 1. The best values of temperatures, luminosities, and masses are taken as those of the nearest point in the best-fitting isochrone, while the uncertainties were estimated based on the scatter in the CMD. Although it is commonly assumed that member stars in a cluster share the same distance, extinction, and age, the main sequence in the CMD is not an infinitely narrow line. Instead, it exhibits scatter due to several external factors, including photometric errors, differential extinction, binarity, variations in internal stellar physics (primarily the extent of overshooting and rotation-induced envelope mixing), and differences in stellar inclination, which affect gravity darkening. We estimated that the scatter in the Gaia G-band magnitude (the y-axis of the CMD) is 0.146 mag, and used this to propagate uncertainties to the effective temperatures, luminosities, and masses.
In Fig. 1, we plot the six selected g-mode pulsators in the Hertzsprung–Russell (HR) diagram, with error bars indicating the uncertainties in effective temperature and luminosity. Intuitively, readers might expect the brighter stars to have lower uncertainties, since their photometric errors are smaller. However, as explained above, the uncertainties in Teff and L were derived from the scatter in the CMD. Because the best-fitting isochrone becomes steeper on the high-temperature side, the resulting uncertainties in luminosity – and consequently in mass – are larger for the hotter pulsators than for the cooler ones.
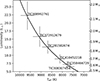 |
Fig. 1. Isochrone-derived luminosities and effective temperatures of the selected γ Dor stars in NGC 2516. The error bars show the 1σ level of the uncertainties. The solid curve is the best-fitting MIST isochrone. |
3. Theoretical model predictions
We used MESA version r24.03.1 to compute rotating 1D stellar structures for the selected g-mode pulsators. At each time step, the resulting stellar structures were passed to the stellar oscillation code GYRE (Townsend & Teitler 2013; Townsend et al. 2018; Sun et al. 2023) to calculate the oscillation frequencies of g modes under the traditional approximation of rotation (TAR, see Bildsten et al. 1996; Lee & Saio 1997; Townsend 2003; Mathis 2013; Saio et al. 2018a) assuming rigid rotation, which is a good approximation for γ Dor pulsators as found by Li et al. (2020b). We assume the stars to be non-magnetic in the first instance because the effects of the Lorentz force are expected to be much smaller than those of the Coriolis force (Aerts et al. 2021; Dhouib et al. 2022; Lignières et al. 2024) except for very strong central fields not yet detected so far (Rui et al. 2024). This might be the result of a magnetic suppression effect as found in slow rotators (Fuller et al. 2015; Stello et al. 2016a; Murphy et al.2020). Evidence for the suppression has not yet been found for fast rotators.
We adopted the same MESA input physics and inlist as used by Mombarg et al. (2024b) 2 and the same inlist for GYRE as in Mombarg (2023) 3. We refer the readers to these two papers for details. One important note is that we used a higher structural resolution by setting mesh_delta_coeff = 0.3. In addition, we did not set a minimum diffusion (set_min_D_mix = .false.). A summary of the input physics, free parameters, and grid construction adopted in our work is provided below.
3.1. Input physics of MESA models
Quite often, the rotational effects caused by the Coriolis and centrifugal forces are only treated at the level of pulsation computations applied to a non-rotating equilibrium model (Aerts 2021). This is justified in the case of slow to modest rotation, because stellar models including rotational effects remain uncalibrated by observations (Aerts & Tkachenko 2024). However, in this work, we have to include a description of rotation in the 1D stellar models because the selected six g-mode pulsators are rotating rapidly. Based on the observed period spacing patterns, Li et al. (2024) reported their rotation rates to be about 50% of the Keplerian critical rotation rates. In MESA versions as introduced since Paxton et al. (2013) and further advanced by Paxton et al. (2019), the shellular approximation is adopted. This approximation assumes that the angular velocity is constant over isobars. The coordinate and structure equations are then refined to impose that a sphere with this refined radius has the same volume as the oblate spheroid in the Roche model, to account for the effects of the centrifugal force (see also Endal & Sofia 1976; Meynet & Maeder 1997; Rieutord et al. 2016; Paxton et al. 2019).
We set the initial fraction of Keplerian critical rotation at the zero-age main sequence (ZAMS), vi/vi, crit, assuming a uniform rotation profile at the ZAMS. Since the stars in NGC 2516 are young (∼100 Myr), we assume that their rotational deceleration is marginal and thus adopted the current seismic rotation rates reported by Li et al. (2024) as their initial rotation rates. For TIC 308307454, we set vi/vi, crit = 0.167, and for TIC 358466729, vi/vi, crit = 0.333. For the remaining selected stars, which have similar seismic rotation rates, we adopted a common value of vi/vi, crit = 0.5.
In general, angular momentum transport involves both advective and diffusive components in the transport equation (e.g., Aerts et al. 2019, for a review of the processes). Here, the angular momentum transport is treated in a fully diffusive way since we use the public MESA code. We did not adopt a radius-dependent viscosity derived from the built-in rotation- and magnetism-induced mechanisms in MESA (Heger et al. 2000; Spruit 2002; Heger et al. 2005), because these prescriptions lead to non-smooth viscosity profiles, which are undesirable for asteroseismic modelling. Instead, a constant viscosity of 107 cm2 s−1 was used, which was calibrated using the slowly rotating γ Dor stars near the terminal-age main sequence (TAMS) (Mombarg 2023). We also accounted for gravity darkening effects at an average inclination (Espinosa Lara & Rieutord 2011; Rieutord et al. 2016; Paxton et al. 2019), although their influence on effective temperature and luminosity is minor and is smaller than the observational uncertainties shown in Fig. 1.
Here, we emphasise the purpose of using rotating 1D models with rotation measured by asteroseismology: we expect that the rotating models can correct their internal structure (e.g., temperature and density) by taking the centrifugal force into account. This correction can reproduce the evolutionary rates and tracks of real stars as closely as possible. We simply used the present-day near-core rotation rates as initial rotation rates. This simplification, on the one hand, reduces one free parameter, and on the other hand, allows us to mimic as much as possible the impact of rotation on stellar structure and evolutionary rates. Our main aim for the forward modelling of the period spacings is to obtain precise age estimates. We therefore took the present-day near-core rotation frequency of the target stars as a fixed parameter rather than using the predicted rotation profile from the MESA models, as this would introduce additional uncertainties on both the initial rotation profile and the efficiency of AM transport. Considering the present-day rotation rate as a fixed parameter implies that we use a uniform rotation profile for the calculations of the oscillation periods. Indeed, the near-core-to-surface rotation ratios in γ Dor stars are close to 1 (Van Reeth et al. 2018; Li et al. 2020b).
We described core convection using the mixing-length theory with a solar-calibrated value of αMLT = 1.8 (Cox & Giuli 1968; Choi et al. 2016). We note that the solar-calibrated value may not be universal, as different calibration methods for the Sun (e.g. Joyce & Chaboyer 2018b) and for non-solar stars (e.g. Metcalfe et al. 2012; Joyce & Chaboyer 2018a) show systematic differences. The value of αMLT may also vary with stellar mass, metallicity (Bonaca et al. 2012; Tayar et al. 2017; Viani et al. 2018), and the choices of other input physics (e.g. Cinquegrana & Joyce 2022). For stars with convective cores (i.e., the g-mode pulsators in this work), the choice of αMLT does not have a strong impact, as core convection is sufficiently efficient (Kippenhahn & Weigert 1994). However, for F-type stars with shallow convective envelopes, the choice of αMLT may still play a role in asteroseismology (Aerts et al. 2018). We refer the reader to the review by Joyce & Tayar (2023) for more information and discuss details in Appendix A.
We adopted the exponentially decaying overshoot fCBM in unit of local pressure scale height to describe the convective-boundary mixing (CBM, Herwig 2000). In the radiative envelope, the chemical diffusion coefficient D was computed from the rotational mixing based on by Zahn (1992) and Chaboyer & Zahn (1992),
 (1)
(1)
where K is the thermal diffusivity, N is the Brunt–Väisälä frequency, rcc is the radius of the convective core, Ω is the rotation profile, and η is a free parameter that modifies the efficiency of the diffusive transport.
Finally, we adopted a solar metallicity of Z = 0.014 (Asplund et al. 2009), consistent with the spectroscopic observations of NGC 2516 by (Li et al. 2024). The present-day cosmic abundances, based on a chemically homogeneous sample of 29 early B-type stars in the solar neighbourhood, were used in our modelling Nieva & Przybilla (2012). An initial helium abundance Y = 0.2612 was set, following the chemical enrichment rate derived by (Verma et al. 2019), which is Y = 0.244 + 1.226Z.
3.2. Model grids for each star
The free parameters for each star are: initial mass M, overshoot fCBM, age t, and the mixing parameter η. Table 2 summarises the ranges and step sizes of the free parameters adopted in our stellar modelling. Two sub-grids are considered: (1) the two low-mass stars TIC 308307454 and TIC 358466729, and (2) all other high-mass stars in the sample. The main differences between these two stem from mass and envelope mixing. For the stellar mass M, we varied it within ±2σ around the observed value, using a step size of 0.01 M⊙ for the two low-mass stars, and 0.02 M⊙ for the rest. The reason is that the two low-mass stars (TIC 308307454 and 358466729) have smaller mass uncertainties, so a smaller mass step was used to pursue a higher grid resolution.
Ranges and steps of the free parameters in the model grid.
The mixing parameter logη was sampled from 1 to 7 with a step size of 1 for the two low-mass stars, and from 1 to 5 for the others. In the process of determining the range of η, we gradually increased its upper limit until the stellar evolution exhibited quasi-chemically homogeneous evolution, which is characterised by a rising temperature during the main-sequence phase because the mixing timescale is shorter than the nuclear timescale (e.g. Maeder 1987; Langer 1992; Martins et al. 2013). We found that stars with higher masses tend to exhibit this behaviour at lower values of η. Therefore, we used logη up to 7 for the two low-mass stars, while limiting it to 5 for the remaining stars.
The range of exponential overshooting parameter fCBM was set from 0.005 to 0.035 with step of 0.0025, covering the previous seismic results for A- to F-type stars (Mombarg et al. 2021). For age t, we allowed models to evolve up to 300 Myr, which is roughly two to three times the ages determined from isochrone fittings (e.g., 102 ± 15 Myr by Li et al. 2024;, 240 Myr by Cantat-Gaudin et al. 2020, and  by Hunt & Reffert 2024). We performed the stellar evolution grid computations on the supercomputers of the Flemish VSC (Vlaams Supercomputer Centrum), using 100 threads with four cores allocated per thread.
3.3. Best-fitting model search
We output an internal profile of the stellar structure computed by MESA every time the central hydrogen mass fraction Xc decreases by 0.01, starting from Xc = 0.72. At each Xc, GYRE was used to calculate the g-mode periods using the rotation rates measured by the observed period spacing patterns by (Li et al. 2024), instead of the MESA-calculated theoretical values. We did not aim for the rotation rates computed by MESA to match the observations, as explained Section 3.1. Our objective was to correct the temperature, luminosity, and evolution, including rotational effects, in the most sensible way, given asteroseismicmeasurements.
We used two methods to search for the best-fitting models relying on: (1) a traditional χ2 merit function, in our application minimising the difference between the predicted and measured mode periods or mode period spacings, and (2) the Mahalanobis distance approach introduced in forward asteroseismic modelling by Aerts et al. (2018) to take into account theoretical uncertainties in the mode period predictions due to shortcomings in the input physics of 1D stellar models. The χ2-based method often assumes that the data are Gaussian distributed and that each of the measured periods or period spacings used in the merit function is independent from all others. In contrast, the Mahalanobis distance accounts for correlations among the measured mode periods or period spacings by incorporating their covariances. Moreover, this merit function also includes the covariances among the theoretically predicted mode periods stemming from the correlations between the free parameters of the stellar models in the grid. As an example, the age of a stellar model in the grid is strongly dependent on the core overshooting value, as the latter determines how much fuel can take part in the nuclear burning active in the convective core as the model evolves. Graphical representations of the correlation structure within grids of models used for g-mode asteroseismology are available in Moravveji et al. (2015), Michielsen et al. (2019, 2021).
While the principle of taking into account theoretical uncertainties in the merit function is uncontested in the era of space asteroseismology (Gruberbauer et al. 2012), its practical application is challenging as we do not know to what extent the physical ingredients captured by free parameters in the models deviate from reality. Following Aerts et al. (2018), this theoretical uncertainty, which is much larger than the observational uncertainties, can be estimated from the grid of models itself, provided that the grid is a reasonable representation of global and seismic properties of stars covering the uncertainty ranges of the observables. Since we seldom know the age or evolutionary stage of a g-mode pulsator in the field of the galaxy with good precision, Pedersen et al. (2021) and Michielsen et al. (2021, 2023) used the correlation structure within their grids of evolutionary models from the birth to the exhaustion of hydrogen in the core in their g-mode asteroseismology. In our application, however, the stellar models were only evolved up to 300 Myr as the age of the cluster is roughly known. This prevents us from properly assessing the correlation structure within the grid of models. As a result, the Mahalanobis distance yields too loose constraints on the minimisation process evaluating the model predictions. We therefore ignore the off-diagonal covariance elements and retain only the diagonal variance terms for both the observations and theoretical predictions. In that case, the Mahalanobis distance reduces to a χ2-type statistic, which can be written as
 (2)
(2)
Here, χj2 is the chi-square of the jth model and Yjtheo is a vector containing the corresponding theoretical grid values of the observables Yobs, which can be either mode periods or mode period spacings. The diagonal matrix V contains the theoretical uncertainties assessed from the grid mode prediction variances.
Following Michielsen et al. (2021), the likelihood function is defined as
 (3)
(3)
where ℒ(D|θ) denotes the likelihood of the data D given the parameters θ, |V + Σ| is the determinant of the sum of the matrix V and Σ, and k = 4 is the number of free parameters, namely the mass M, the mixing parameter η, the overshoot fCBM, and the age t. The observational uncertainties, represented by the elements of Σ, are typically much smaller than the model uncertainties, which are written in the diagonal elements of the matrix V. Therefore, it is necessary to develop an appropriate method for estimating the uncertainties for the mode periods predicted theoretically from the grid, of relevance for each of the pulsators. Our approach is to estimate the uncertainty arising from variations in stellar mass and age. Specifically, we calculated the standard deviations of the selected theoretical values of the periods or period spacings within a narrow parameter range: a mass variation ΔM of 0.02 M⊙ and an age variation Δt of 10 Myr. The range in mass was determined by the step size of the input grid, while the range in age was derived from the uncertainty given by the isochrone fitting. We found that within these ranges, the model variations provide a reasonable estimate of the theoretical uncertainty, while also offering sufficient constraints to identify the best-fitting models. In this way, the matrix V serves both to constrain the model selection and to quantify the model uncertainty. We also experimented with including variations in the overshooting parameter, namely by adding another dimension with ΔfCBM ≤ 0.0025, but this resulted in overly loose constraints that prevented the identification of best-fitting models. In addition, we tested the impact of the mixing parameter η and found that it has little influence on the modelled periods.
We calculated the likelihood function at each evolutionary step using Eq. (3), and then ran a Markov Chain Monte Carlo (MCMC) simulation using the Python package emcee (Foreman-Mackey et al. 2013) to search for the best-fitting models. Flat priors for Teff and L were adopted within the 2σ ranges of the observational constraints listed in Table 1, while a flat prior for age t was set between 50 and 300 Myr.
For the observables Yobs and the corresponding theoretical values  , we used g-mode periods for most of the stars. However, we found that the period spacing pattern of TIC 281582674 exhibits a significant dip, and using periods as observational constraints could not efficiently reproduce the dip. Therefore, we used period spacings as observables for TIC 281582674 instead.
3.4. Individual or joint fitting of modes
We applied two fitting approaches to search for the best-fitting models. In the first approach, we fitted the stars individually, allowing them to have different ages despite being located within the same cluster. In the second approach, we demanded the age to be the same for all targets and constructed the joint likelihood function by summing the logarithms of the individual likelihoods of each star, namely,
 (4)
(4)
where D′ represents the combined observables of all stars, θ′ denotes the collection of individual stellar parameters M, fCBM, and η for all stars, θi denotes the free parameters for each star except for the age t, and t is the common age. Approach 1 allows additional freedom in age, which generally leads to a better reproduction of the observed period spacing patterns. In contrast, Approach 2 is more consistent with the physics of open clusters, where stars are generally assumed to have formed simultaneously.
4. Results of the asteroseismic modelling
We list the best-fitting parameters and their uncertainties in Table 3, derived from both Approach 1 and Approach 2. Since the parameters are selected from discrete grid points, the traditional method of estimating the uncertainties and median values using the 16th, 50th, and 84th percentiles may be unsuitable. Therefore, we fitted a Gaussian distribution to each of the marginalised one-dimensional posterior distributions to derive their uncertainties. In cases where the standard deviation of the fitted Gaussian is smaller than the grid step size, we adopt the grid step as the uncertainty. This situation often arises for the overshooting parameter fCBM, indicating that the modelling is overly sensitive to its value. We conclude that the current grid step of 0.0025 is still too large to capture the sensitivityadequately.
Best-fitting parameters for the successfully fitted stars.
We present two representative stars, TIC 308307454 and TIC 281582674, as case studies in Sections 4.1 and 4.2, respectively. The results on the seismic age of the open cluster, the constraints on fCBM, and the influence of the mixing parameter η are discussed after that. In Table 3, we include only four stars for which satisfactory fits were obtained. The two high-mass stars, TIC 372912679 and TIC 308992761, could not be fitted successfully, and we discuss the possible reasons in Section 4.6.
4.1. TIC 308307454
TIC 308307454 is the star with the lowest mass in our sample. The posterior distributions of its parameters are shown in Fig. 2, and the best-fitting period spacing pattern is shown in Fig. 3. Our best-fitting seismic model yields a mass of 1.537 ± 0.008 M⊙, which lies within 1σ range of the MIST isochronal mass. As shown in Fig. 3, both the observed and theoretical period spacing patterns are smooth, indicating that dips due to mode trapping caused by a chemical gradient are absent (Miglio et al. 2008; Bouabid et al. 2013; Pedersen et al. 2018). We obtain a strong constraint on the overshooting parameter fCBM as most of the MCMC chains converge to a value of fCBM = 0.005.
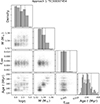 |
Fig. 2. Posterior distributions of the model parameters for TIC 308307454 obtained using Approach 1. The diagonal panels show the marginalised 1D distributions for each parameter, where the solid and dashed vertical lines indicate the median and the ±1σ range, respectively. The off-diagonal panels display the 2D joint posterior distributions. We added random noise to the discrete samples for clarity. |
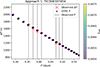 |
Fig. 3. Observed and best-fitting period spacing pattern of TIC 308307454 from Approach 1. The vertical grey lines indicate the observed g-mode periods, and their period spacings are shown as red crosses. We randomly selected 30 period-spacing patterns from the MCMC result computed with GYRE, shown as circles, with the colour bar indicating the value of fCBM. |
For TIC 308307454, we computed stellar evolution models with logη values up to 7. However, as shown in Fig. 2, the star reveals weak envelope mixing: the posterior distribution of logη is roughly flat below 4 and then drops sharply towards larger values. This result suggests that the star with M ∼ 1.5 M⊙ has low envelope mixing at early evolutionary stages on the main sequence.
The age estimate from Approach 1 is 152 ± 18 Myr, which is larger than the MIST isochrone age reported by Li et al. (2024). This star provides a precise age constraint, as the asymptotic spacing in this mass range decreases monotonically with age (Mombarg et al. 2019). Li et al. (2024) reported an observed asymptotic spacing of  and a near-core rotation rate of
  . These observed values are model independent. Our best-fitting model yields a higher value of Π0, namely 4504 s, which lies at the upper boundary of the ±1σ observational range. Although we did not use the measured rotation rate as a constraint in the seismic modelling but rather considered models rotating at 16.7% of their critical rate for this star, the best-fitting asteroseismic model delivers a near-core rotation rate of 0.973 d−1, consistent with the measured value from the observed period spacing pattern.
We also test how different choices of the mixing-length parameter αMLT affect our model results, particularly the calculated period-spacing pattern. As shown in Appendix A, we find that varying αMLT has no appreciable impact on the modelling results.
4.2. TIC 281582674
We use TIC 281582674 as a second representative example, as this star has the highest mass in our sample of four pulsators and is the only one that exhibits a clear dip in its period spacing pattern. The posterior distributions and the best-fitting period spacing pattern are shown in Figs. 4 and 5, respectively. Our best-fitting seismic model yields a mass of 1.752 ± 0.018 M⊙, which is 1σ lower than the isochrone-derived mass. Consequently, the model predicts a lower effective temperature and luminosity, both of which lie near the lower boundary of the ±2σ observational ranges. This lower mass is required to match the observed asymptotic period spacing of 4840 ± 60 s by Li et al. 2024). Our best seismic model has Π0 = 4872 s.
The red crosses in Fig. 5 represent the observed period spacing pattern. A ‘half dip’ is visible on the long-period side. As discussed previously, we fitted period spacings instead of individual periods, since using period spacing as the observable Yobs is more sensitive to this dip. In the same figure, we find that the location of the dip is highly sensitive to the value of fCBM. The model with fCBM = 0.03 best reproduces the observed dip, while models with other values fail to do so. Therefore, this star also places a strong constraint on the overshooting parameter, yielding fCBM = 0.0300 ± 0.0025. We also find that the posterior distribution of logη is similar to that of TIC 308307454, with a preference for lower values, implying weak envelope mixing in this star as well.
The stellar age is also well constrained in this case. Although the dependence of Π0 on age is relatively flat within the age range of NGC 2516 (see discussion in Section 4.3), the position of the dip in the period spacing pattern evolves sensitively with age and helps constrain it. We derive an age of 111 ± 15 Myr for this star, which is younger than TIC 308307454 and closer to the MIST-based age.
To test the sensitivity of the mixing length parameter (αMLT, fixed to 1.8 in this work) on the calculated oscillation periods, we computed two additional models with αMLT = 2.0 for the best-fitting cases of TIC 308307454 and TIC 281582674. We find that varying αMLT does not significantly affect the evolutionary tracks, Π0, or the g-mode pulsation periods when mode trapping is absent. However, different αMLT values do change the g-mode cavity slightly, and consequently alter the time at which the dip in TIC 281582674 appears. We present these results and further discussion in Appendix A.
We also present the posterior distributions and the best-fitting period spacing patterns using Approach 1 for the remaining two stars, TIC 358466729 and TIC 410452218, in Figs. B.1, B.2, B.3, and B.4 of Appendix B. We find that these two stars have more limited capacity to constrain their parameters, showing somewhat larger uncertainties compared to the previous two stars. For the fitting results by Approach 2, we present similar figures in Appendix C.
4.3. Overshoot fCBM
Figure 6 summarises the overshoot measurements of the four g-mode pulsators in NGC 2516 fitted in this work using Approach 1. Apart from the four g-mode pulsators in this work, we also include overshoot measurements from previous studies. For intermediate- to high-mass g-mode pulsators, we show the results of 37 γ Dor stars modelled using a deep-learning method by Mombarg et al. (2021), and 26 SPB stars from Pedersen (2022). For solar-like oscillators, we include the fossil overshoot measurements during the main-sequence stage reported by Deheuvels et al. (2016) and Lindsay et al. (2024). Although these solar-like oscillators have evolved to the post-main-sequence stage, the chemical composition gradients produced by core overshooting remain as fossil signatures and can be detected through mixed modes (Deheuvels & Michel 2011). We also note the studies by Noll & Deheuvels (2023) and Noll et al. (2021), which reported overshooting values comparable to those from other works in the mass range below 1.5 M⊙. In contrast, Viani & Basu (2020) reported significantly larger overshooting values, with some stars showing αov as high as 0.4. These discrepancies may stem from differences in the treatment of the temperature gradient within the overshooting region. For this reason, we do not include the results by Viani & Basu (2020) in the present comparison.
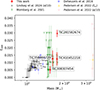 |
Fig. 6. Convective mixing parameter fCBM as a function of mass by Approach 1. The red points and their error bars represent the four g-mode pulsators analysed in this work. The translucent markers indicate results from previous studies. |
As listed in Table 3, TIC 308307454 shows the smallest value of fCBM, while TIC 281582674 exhibits the largest. The remaining two stars, TIC 358466729 and TIC 410452218, display intermediate levels of overshooting. The values of fCBM for our g-mode pulsators, which have masses between approximately 1.5 and 2.0 M⊙ (corresponding to γ Dor-type pulsators), show a wide spread ranging from 0.005 to 0.030. This spread is consistent with the findings of Mombarg et al. (2021). A similarly large spread in overshooting parameters has also been reported for SPB stars by Pedersen (2022), with some values reaching fCBM = 0.040, or αov = 0.4 under the step overshooting scheme. However, we find that the range of fCBM values varies with stellar mass. For low-mass stars (M ≲ 1.5 M⊙), fCBM is typically smaller than ∼0.015, more tightly distributed, and shows an increasing trend with mass. Furthermore, Mombarg et al. (2024a) found that most γ Dor stars have relatively low values of fCBM, with a linearly decreasing probability density distribution for increasing fCBM, based on 539 stars.
We therefore emphasise the importance of fCBM in isochrone-based age dating. For young open clusters whose main-sequence turn-off lies within the B- to A-type range, the derived age is primarily constrained by the evolution of these early-type stars. However, these stars show a large spread in the overshoot parameter, which significantly affects stellar evolution, particularly the duration of the main-sequence phase. As a result, adopting a single value of fCBM across the entire mass range may not accurately reproduce the true cluster age, although this is a commonly used compromise (such as the MIST isochrone that adopted a fixed value of fCBM = 0.016 calibrated on the open cluster M67; e.g. Magic et al. 2010; Choi et al. 2016). An optimised tactic, such as ‘isochrone-cloud’ fitting to the CMD of clusters using multiple combinations of parameters (fCBM, rotation, radiative envelope mixing, etc.), is needed to assess the age uncertainty arising from stellar models (e.g. Johnston et al. 2019a; Johnston 2021).
4.4. Individual seismic ages of the g-mode pulsators in NGC 2516
In Fig. 7, we summarise the age measurements of the four g-mode stars in NGC 2516 using both Approach 1 and Approach 2. In Approach 1, where individual ages are allowed for each star, we find a significant spread in the inferred ages. TIC 281582674 yields the youngest age (111 ± 15 Myr), which is consistent with the MIST isochrone age reported by Li et al. (2024). In contrast, TIC 308307454 has an age of 152 ± 18 Myr, which deviates from the MIST isochrone age at the 2σ level. We note that TIC 410452218 and TIC 358466729 exhibit large uncertainties in their age estimates, implying a limited capacity for precise age determination.
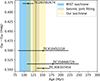 |
Fig. 7. Seismic age estimates for the four g-mode stars in NGC 2516. The stars are vertically ordered by increasing Gaia colour index GBP − GRP. Horizontal error bars indicate the individual seismic ages derived using Approach 1. The vertical grey line and the grey shaded region mark the seismic age and ±1σ range obtained from joint modelling of all the four stars using Approach 2 (“Seismic joint fitting”). The vertical blue shaded region represents the MIST isochrone age derived from CMD fitting. The vertical gold shaded region represents the age derived using our own isochrone deduced from the seismic model grid, see Section 5. |
It is well known that the asymptotic period spacing, Π0, serves as an age indicator in g-mode pulsators (e.g. Miglio et al. 2008; Saio et al. 2018a; Ouazzani et al. 2019; Mombarg et al. 2019), as Π0 decreases monotonically with age during the main-sequence phase. To explore the relationship between Π0 and age in our modelling, we plot Π0 as a function of age in Fig. 8, adopting a fixed value of η = 1 and considering two values of fCBM. We find that the evolutionary trend of Π0 with age varies significantly with stellar mass. For stars around 1.5 M⊙, Π0 exhibits a sharp decline over time, with a decrease of up to 200 s within 300 Myr–exceeding the typical observational uncertainty of Π0 (approximately 100 s). This explains why TIC 308307454 (M ∼ 1.54 M⊙) can provide a well-constrained age. However, the sensitivity of Π0 to age diminishes with increasing mass: at M ∼ 1.7 M⊙, the total variation in Π0 is roughly 100 s within 300 Myr, while at M ∼ 1.8 M⊙, Π0 remains nearly constant. This mass range corresponds to TIC 358466729 and TIC 410452218, which explains why these two stars yield somewhat poorer constrained ages. TIC 281582674, on the other hand, benefits from the presence of a dip in its period spacing pattern, which aids in constraining its age. We therefore emphasise that precise age constraints from g-mode pulsators require either low-mass stars (e.g. γ Dor stars) or the detection of mode trapping signatures in the period spacing patterns.
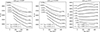 |
Fig. 8. Asymptotic spacing Π0 as a function of age, for models with different initial rotation rates and overshooting parameters. The left, middle, and right panels correspond to initial rotation rates of Ω/Ωcrit, i = 0.167, 0.333, and 0.5, respectively. The mixing parameter η is fixed at 1 in all models. Each set of curves shows evolutionary tracks for different stellar masses with two overshoot values: fCBM = 0.005 (solid lines) and fCBM = 0.025 (dashed lines). Masses for the dotted curves (fCBM = 0.025) are indicated to the left of each line, while those for the solid curves (fCBM = 0.005) are placed to the right. |
We also find that Π0 starts to increase at the beginning of the main sequence if the mass is approximately greater than 1.8 M⊙. The behaviour may change depending on the adopted value of fCBM. In the right panel of Fig. 8 for vi/vcrit, i = 0.5, we find that Π0 first increases and then decreases for fCBM = 0.005, while it continues to increase for fCBM = 0.025. These features may challenge age determinations using high-mass g-mode pulsators in young open clusters, as Π0 no longer shows a monotonic relation with age. An increasing Π0 is indicative of a growing convective core (e.g. Mombarg et al. 2019; Aerts et al. 2025). As simulated by Temaj et al. (2024), a larger fCBM leads the core to grow in mass, causing the star to behave as if it had a higher initial mass and ultimately altering its final fate.
In addition to modifying whether Π0 increases or decreases with age, we find that fCBM also affects the absolute value of Π0. When the mass is roughly below 1.8 M⊙, Π0 always decreases monotonically with age, but smaller fCBM values tend to produce lower Π0 values. The reduction can be as large as 100 s and gradually disappears when M ≳ 1.8 M⊙.
4.5. Joint age measurement of NGC 2516
As introduced in Section 3.4, instead of allowing the stars to have different ages (Approach 1), we assumed that the stars share a common age, as they were born simultaneously in the same cluster. We thus fitted them jointly using the likelihood defined in Eq. (4) (Approach 2). This joint fitting approach yields an asteroseismology-derived age for NGC 2516 of 132 ± 8 Myr.
The vertical grey band in Fig. 7 represents the joint age result. We find that the seismic joint age (132 ± 8 Myr) differs from the MIST isochrone age (102 ± 15 Myr) by approximately 1.5σ. In Section 5, we demonstrate that this age discrepancy arises from differences in the adopted input physics of the MIST isochrone. When using identical input physics to define isochrones and perform forward asteroseismic modelling, the isochrone-fitting and seismic-fitting methods yield consistent age measurements.
The best-fitting period spacing patterns and the posterior distributions from Approach 2 are presented in Appendix C. Compared to Approach 1, the period spacing patterns obtained from Approach 2 show a slightly poorer fit, as the condition of a joint age may not optimally reproduce the individual stars’ period spacing patterns. Nevertheless, the resulting best-fitting parameters (M, fCBM, logη) remain highly consistent with those derived from Approach 1, as listed in Table 3.
4.6. Seismic and MIST-based mass discrepancy
As mentioned earlier, the two high-mass stars, TIC 372912679 and TIC 308992761, could not be modelled. We find that this is because the observed values of Π0 cannot be reproduced within the MIST-based mass ranges given in Table 1. Figure 9 illustrates this situation. As reported by Li et al. (2024), TIC 372912679 has  , while TIC 308992761 has
  (shown as the horizontal shaded regions in Fig. 9, respectively). However, comparison with our seismic models shows that these Π0 values correspond to masses around 1.74 M⊙, deviating by 2 to 3σ from the MIST-derived masses listed in Table 1 (which are around 2 M⊙). We also note that TIC 281582674 reaches its lower bound of its allowed mass range during the fitting process. Therefore, we find a discrepancy between our asteroseismic masses and the MIST-based isochrone masses, and this discrepancy becomes more pronounced with increasing stellar mass.
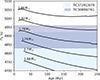 |
Fig. 9. Asymptotic period spacing Π0 as a function of stellar age for models with fixed initial rotation vi/vi, init = 0.5, fCBM = 0.025, logη = 3, but different initial masses. The horizontal shaded regions indicate the observed Π0 values (and uncertainties) for TIC 372912679 and TIC 308992761. |
Mass discrepancies among different stellar mass estimation methods are not rare and have been noted by numerous previous studies. These studies commonly compare evolutionary masses based on models with one particular choice for the input physics with dynamical masses in binary systems. The dynamical masses are derived from the binary orbital motion and are therefore model-independent, making binaries ideal as benchmarks. For example, a significant mass discrepancy in the evolved massive binary V380 Cyg was reported by comparing its dynamical mass and evolutionary mass inferred from theoretical evolutionary tracks (Guinan et al. 2000; Tkachenko et al. 2014). Analyses of binary star samples by Schneider et al. (2014), Claret & Torres (2019), and Tkachenko et al. (2020) revealed systematically occurring mass discrepancies between dynamical and evolutionary masses. These studies argued that both enhanced core overshooting and proper treatment of microturbulent velocities and turbulent pressure in stellar atmosphere models can partially resolve the discrepancies.
Pulsating binaries allow us to compare the seismic and dynamical masses. Schmid et al. (2015) reported the dynamical masses for the two g-mode pulsators in the non-eclipsing binary KIC 10080943, which shows a periodic brightening effect along its 15.3 d eccentric orbit. The masses of the primary and secondary were deduced from photometric light curve modelling and spectral disentangling, leading to component masses of 2.0 ± 0.1 M⊙ and 1.9 ± 0.1 M⊙, respectively, similar to our targets TIC 372912679 and TIC 308992761. In a subsequent asteroseismic modelling study, Schmid & Aerts (2016) found that the seismic masses were about 2σ lower than the binary masses, hence their results for the two γ Dor stars in this close binary are similar to ours for the two more massive γ Dor stars in the cluster. Schmid & Aerts (2016) attempted to modify the initial helium mass fraction but found that this adjustment did not significantly increase the seismic masses.
Isochrone-derived masses close to the regime of the γ Dor stars have also been scrutinised. The eclipsing binary WOCS 11028 in M67 was found to show a significant discrepancy between its dynamical and isochrone-derived masses (Sandquist et al. 2021). Subsequent studies confirmed this discrepancy using updated isochrone models (Nguyen et al. 2022; Reyes et al. 2024, 2025).
Mass discrepancies are also found in other mass ranges or in different evolutionary stages, such as O-type stars (Weidner & Vink 2010; Markova et al. 2018), Cepheids (Neilson et al. 2011), and white dwarfs (Calcaferro et al. 2024). Various attempts have been made to resolve the mass discrepancies by adjusting stellar model parameters, for example, by adopting a larger overshooting parameter to produce a more extended convective core (Tkachenko et al. 2020). However, as shown in Fig. 8, varying fCBM has only a minor effect on Π0 in this mass range, pointing out that the input physics itself needs to be changed, rather than simply adapting the free parameters in the particularly frozen convective core overshooting description. Motivated to resolve the mass discrepancy for the two massive γ Dor pulsators in NGC 2516, we embarked upon self-constructed asteroseismically-calibrated isochrones. In the next section, we demonstrate that adopting identical input physics to that used in the seismic models can partially alleviate the mass discrepancy.
5. Self-constructed isochrone using input physics from asteroseismology
In Section 4.5, we reported that the joint seismic age of NGC 2516 deviates from the MIST isochrone age by 2σ. In Section 4.6, we also discovered mass discrepancies for two high-mass g-mode pulsators when compared to the MIST masses. Given that the MIST isochrones are constructed using different input physics, which may introduce inconsistencies with our seismic modelling, we therefore construct our own isochrones. These are both physically consistent with and calibrated by asteroseismology. Subsequently, we assess whether the discrepancies are resolved by the asteroseismic isochrone of NGC 2516.
5.1. Construction of our own isochrones
To simplify the construction procedure, we customise our isochrone development to young open clusters. We consider only the upper main sequence of the CMD as input observables, corresponding to main-sequence stars with masses larger than ∼1.5 M⊙ (see black dots in Fig. 11 discussed below). This mass boundary can be visually identified from the CMD, where the slope of the main sequence changes noticeably. We used the member stars of NGC 2516 reported by Meingast et al. (2021) and discarded both low-mass main-sequence stars and post-main-sequence stars in NGC 2516. This simplifies the isochrone construction by avoiding the need to consider different physical treatments required for cool stars and evolved stars. We checked the Gaiaruwe values for the member stars and excluded those with ruwe > 1.4, which may indicate binarity. However, only a few stars were affected. In addition, two potential blue stragglers were excluded from the fitting process.
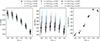 |
Fig. 10. Results of our self-constructed isochrone fitting for various combinations of convective boundary mixing and envelope mixing efficiency, as a function of initial rotation fraction vi/vi, crit. The legend at the top indicates the different combinations of η (envelope mixing parameter) and fCBM (convective boundary mixing). Symbols of the same colour share the same value of fCBM, while different colours correspond to different values of η. The data points are artificially shifted to avoid overlapping. Left: the Gaia extinction parameter A0 as a function of initial rotation fraction. Middle: the best-fitting cluster age as a function of rotation. Right: the log-likelihood of the best-fitting isochrone. Error bars indicate 1σ confidence intervals. |
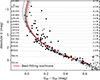 |
Fig. 11. Best-fitting result of the self-constructed isochrone with η = 10, fCBM = 0.025, and vi/vi, crit = 0.5. The red curve represents the best-fitting isochrone, while the grey curves show 20 randomly selected samples from the MCMC chains, showing the uncertainty region. The small grey dots indicate member stars from Meingast et al. (2021), and the black dots are the upper main-sequence stars used as input observables. The modelled g-mode pulsators are marked with light blue squares. |
As stars on the main sequence evolve slowly, we adopted a mass step of 0.05 M⊙, which is sufficiently fine to reproduce the structure near the main-sequence turn-off. We computedevolutionary tracks from 1.5 M⊙ to 8 M⊙, covering stellar ages from a few million years up to several hundred million years. We adopt the same input physics as for the asteroseismology and consider a range of input parameters, including initial rotation rate fractions vi/vi, crit from 0 to 0.5 in steps of 0.1, convective boundary mixing values of fCBM = 0.005, 0.015, and 0.025, and envelope mixing parameters η = 1, 10, and 100.
We briefly summarise the input physics used for our seismic modelling in Section 3.1, to highlight the differences with the input physics of the MIST isochrones (Choi et al. 2016). First, we treat angular momentum (AM) transport using a scheme with an asteroseismology-calibrated constant viscosity, and model chemical element diffusion with a differential-rotation-induced mechanism encompassing a diffusion coefficient η (Eq. (1)), whereas the MIST isochrones adopt the built-in prescriptions in MESA for both AM transport and chemical diffusion (see Choi et al. 2016; Mombarg 2023, for details). Second, while the formulation of core overshooting is the same, we allow three values for the exponential overshooting parameter reflecting the asteroseismic modelling results, while the MIST models use a fixed value of fov, core = 0.0160. Third, we adopted a constant initial rotation fraction for all main-sequence stars, set to vi/vi, crit = 0.5. This value was measured from the g-mode period spacing patterns of 11 g-mode pulsators by Li et al. (2024). In contrast, the MIST isochrones adopt a mass-dependent rotation prescription, where the rotation rate increases linearly from zero at 1.2 M⊙ to a fixed value at 1.8 M⊙. Fourth, we employ an asteroseismology-calibrated primordial helium abundance and element enrichment rate, whereas the MIST models use cosmology-calibrated ones (Planck Collaboration XIII 2016).
After obtaining the theoretical evolutionary tracks, which provide the effective temperature and luminosity at each evolutionary time step, we constructed an isochrone by selecting the points on each track corresponding to a given age. We applied bolometric and extinction corrections to transform the theoretical Teff and L into observed magnitudes and colour indices. To achieve this, we adopted the same bolometric corrections as the MIST isochrones, which are based on a grid of stellar atmospheres and synthetic spectra computed using the ATLAS12 and SYNTHE codes (Kurucz 2005; Choi et al. 2016). We adopted the Gaia extinction law given for the Gaia photometric bands4 (Danielski et al. 2018; Fitzpatrick et al. 2019; Riello et al. 2021).
5.2. Fitting process
As we only used the upper main sequence as the input observables, the shape of the CMD was relatively simple, exhibiting a monotonic relation between the absolute G-band magnitude and the Gaia colour index GBP − GRP. Therefore, we considered the absolute G-band magnitude as the independent variable and minimised the residuals of the Gaia colour index to determine the best-fitting model. The uncertainty of the Gaia colour index was estimated using the same method as in Section 2. This uncertainty was significantly larger than the photometric error bars provided by the Gaia archive, as it contains additional sources of uncertainty beyond pure photometric noise, as discussed in Section 2. An MCMC algorithm was used to maximise the likelihood function based on the residuals of the Gaia colour index. Flat priors for A0 and age were applied. During the CMD fitting, we treated the extinction at λ = 550 nm (A0) and the cluster age as two free parameters. The observed CMD was fitted using all combinations of fCBM, η, and vi/vi, crit.
5.3. Results of the self-constructed isochrones
The best-fitting results are shown in Fig. 10. The left panel displays the derived values of A0 for various combinations of input parameters. We find that the rotation rate has the dominant effect on A0: faster rotation leads to significantly lower values of A0, whereas the other two parameters (fCBM and η) have negligible influence. This is because rotation substantially changes the stellar structure and surface temperature distribution, thereby affecting the extinction.
In the middle panel of Fig. 10, we find that both fCBM and rotation influence the age determination. Larger overshooting results in older inferred ages, while faster rotation leads to younger ages. Additionally, the age estimates converge as vi/vi, crit increases. The right panel of Fig. 10 shows the likelihood values of the best-fitting isochrones. We find that isochrones with higher rotation rates generally provide better fits. We also noted that the isochrone fitting quality is insensitive to the values of η. Upon inspecting the best-fitting isochrones overlaid on the observed CMD, we realise that isochrones with low rotation rates fail to reproduce the observed main sequence, resulting in lower likelihood values.
Based on both the likelihood function and the asteroseismic results, we selected the isochrones with vi/vi, crit = 0.5 as the best-fitting models. However, the inferred age also exhibits a slight dependence on the choice of fCBM, ranging from approximately 120 Myr to 140 Myr as fCBM increases from 0.005 to 0.025. Considering the asteroseismic measurements of the overshooting parameter in B-type stars (as shown in Fig. 6, Pedersen 2022), which suggest a median value of fCBM ≈ 0.025, we combined the posterior distributions with all η = 1, 10, 100 and fCBM = 0.005, 0.015, 0.025 as final posterior distributions. This strategy is a solution to the so-called ‘isochrone-cloud’ fitting, as it takes the occurring diversity in mixing levels into account (e.g. Johnston et al. 2019a; Johnston 2021). Finally, we obtain A0 = 0.37 ± 0.03 mag and an age of 129−23+28 Myr. As a reminder, the MIST fit yielded A0, MIST = 0.53 ± 0.04 mag and an age of 102 ± 15 Myr (Li et al. 2024). We show the best-fitting self-constructed isochrone in Fig. 11.
We find that, compared to the previous MISTA0 measurement, the newly derived extinction, A0 = 0.37 ± 0.03 mag, agrees better with other independent extinction estimates. Using the Gaia extinction law, we convert A0 to reddening at 8000 K, yielding E(BP − RP) = 0.18 ± 0.04 mag. Applying the conversion coefficient from Casagrande & VandenBerg (2018), which states that E(BP − RP) = (3.374−2.035)E(B−V), we derive a corresponding E(B−V) = 0.13 ± 0.03 mag. This revised reddening is more consistent with the result of Sung et al. (2002), who reported E(B−V) = 0.112 ± 0.024 mag, and also agrees better with the Gaia total Galactic extinction map5 (which gave A0 = 0.4358; Delchambre et al. 2023).
The newly derived age from our self-constructed isochrone is in good agreement with the seismic age. As shown in Fig. 7, the age inferred from the self-constructed isochrone has nearly the same median value as the seismic age, although it has a larger uncertainty. This is expected, as red giants were not included in the isochrone fitting and the main-sequence turn-off exhibits significant scatter. We thus demonstrate that the asteroseismology-calibrated isochrone yields an age for NGC 2516 that is consistent with the result from seismic modelling of four g-mode pulsators in the cluster.
The mass discrepancy is partially, but not entirely, resolved when using our self-constructed isochrone with asteroseismology-measured rotation rates. The revised mass estimates from the best-fitting self-constructed isochrone for the six g-mode pulsators are shown in Fig. 12. Compared to the MIST-based masses listed in Table 1, the masses derived from the self-constructed isochrone are systematically lower. For the two lower-mass stars, TIC 308307454 and TIC 358466729, the mass differences are small (approximately −0.04 M⊙) and are within the error bars. This explains why no significant mass discrepancy was observed for those pulsators in the first place. However, the mass differences increase with stellar mass: TIC 372912679 shows a shift of −0.08 M⊙, and TIC 308992761 shows a shift of −0.11 M⊙. We attribute these mass shifts to the adopted rotation rate, as we find that using a self-constructed isochrone with a lower initial rotation rate reduces the mass shifts. This result highlights the importance of carefully selecting initial rotation rates, as they directly influence mass estimates of cluster members.
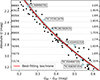 |
Fig. 12. Same as Fig. 11, but only showing stars with masses up to 2.0 M⊙. The modelled g-mode pulsators are marked with light blue squares. |
Even after accounting for these mass shifts, the self-constructed isochrone still does not fully reconcile the mass values with those obtained from seismic estimation based on the observed internal structure quantity Π0 (approximately 1.75 M⊙; see Fig. 8), leaving a small residual mass discrepancy of about 0.1 M⊙. This discrepancy is similar to the previous findings in the g-mode binary KIC 10080943 (Schmid et al. 2015; Schmid & Aerts 2016) and highlights a mismatch between the internal and surface input physics adopted in the best current 1D stellar models and the reality of fast-rotating 3D stars.
6. Conclusions
In this paper, we presented the first asteroseismic modelling of a sample of g-mode main-sequence pulsators in a young open cluster. Our approach was to constrain the stellar surface parameters using the best-fitting isochrone in the colour–magnitude diagram (CMD), without relying on any spectroscopic data. This was then followed by seismic modelling based on observed g-mode period spacing patterns of γ Dor pulsators in the cluster. Their asteroseismic observables probe the internal rotation and physical conditions in the transition zone between the convective core and the radiative envelope. These two steps together provide a novel method to measure cluster ages with high precision and offer new insights into the internal structure of intermediate-mass stars, particularly the connection between their cores and surfaces.
Building on the results of Li et al. (2024), we constrained the effective temperatures, luminosities, and masses of six g-mode pulsators in NGC 2516, as listed in Table 1. These tight constraints enabled the construction of a fine grid of stellar models. We employed rotating stellar models computed with MESA, incorporating an asteroseismology-calibrated viscosity for angular momentum transport and rotation-induced mixing in the radiative envelope. Theoretical g-mode pulsation periods were subsequently calculated using GYRE. The best-fitting models were determined by matching the observed and calculated periods of identified g modes. We employed two approaches for the asteroseismic modelling. In Approach 1, we fitted the stars individually, allowing each to have its own age. In Approach 2, we performed a joint fit, assuming that all stars share a common age.
Using Approach 1, we determined the stellar masses and the convective core overshooting parameter. The envelope mixing parameter η could not be constrained, as the observed smooth period spacings are insensitive to the envelope mixing, pointing to the absence of strong chemical composition gradients. The inferred ages range from approximately 111 to 152 Myr, with some estimates exhibiting large uncertainties due to the slow evolution of Π0 near the zero-age main sequence.
Using the full power of joint modelling of g-mode pulsators in a cluster (Approach 2), we determined the high-precision seismic age for NGC 2516 to be 132 ± 8 Myr. This value deviates from the MIST-based age (102 ± 15 Myr) at the level of 2σ. This age discrepancy points to inconsistencies between the MIST isochrones and our seismic models, which arise from differences in the adopted input physics. Additionally, a significant discrepancy was found between the MIST-derived and seismic masses for higher-mass γ Dor pulsators, with the seismic masses being approximately 0.3 M⊙ lower than the mass estimates from MIST.
To investigate whether the age and mass discrepancies can be mitigated by adopting consistent input physics, we constructed our own isochrones, which are calibrated using the asteroseismic results. This results in a high consistency between isochronal and asteroseismic modelling, where we accounted for the different values of η and fCBM for the different pulsators. The newly derived extinction value (A0 = 0.37 ± 0.03 mag) from the new isochronal modelling is more consistent with independent observational estimates than the MIST-based value, and the newly derived age (129−23+28 Myr) shows that the age discrepancy between the MIST isochrone and the joint asteroseismic age of the pulsators was eliminated. However, the mass discrepancy was only partially resolved, indicating a persistent modest mismatch between the stellar core and envelope physics in the models and the observed properties of the stars.
Our novel methodology and its application to NGC 2516 opens up additional applications of powerful young open cluster asteroseismology, with Gaia and TESS (or in the future PLATO, Rauer et al. 2025) data as observational input. We have shown that our asteroseismic cluster modelling method leads to an age estimation with a superb 6% relative precision.
Transiting exoplanet survey satellite (Ricker et al. 2015).
Acknowledgments
The authors are grateful for valuable discussion with Dr. Aaron Dotter, particularly for his encouragement to construct asteroseismically based isochrones. The research leading to these results has received funding from the European Research Council (ERC) under the Horizon Europe programme (Synergy Grant agreement N°101071505: 4D-STAR). While funded by the European Union, views and opinions expressed are however those of the author(s) only and do not necessarily reflect those of the European Union or the European Research Council. Neither the European Union nor the granting authority can be held responsible for them. GL acknowledges the Research Foundation Flanders (FWO) for a short stay abroad grant to attend the MESA Down Under School (grant K224824N), and travel support from the National Natural Science Foundation of China (NSFC) through grant 12273002 and the key project 12233013. The computational resources and services used in this work were provided by the VSC (Flemish Supercomputer Center), funded by the Research Foundation Flanders (FWO) and the Flemish Government.
References
- Aerts, C. 2021, Rev. Mod. Phys., 93, 015001 [Google Scholar]
- Aerts, C., & Tkachenko, A. 2024, A&A, 692, R1 [NASA ADS] [CrossRef] [EDP Sciences] [Google Scholar]
- Aerts, C., Christensen-Dalsgaard, J., & Kurtz, D. W. 2010, Asteroseismology (Heidelberg: Springer-Verlag) [Google Scholar]
- Aerts, C., Molenberghs, G., Michielsen, M., et al. 2018, ApJS, 237, 15 [Google Scholar]
- Aerts, C., Mathis, S., & Rogers, T. M. 2019, ARA&A, 57, 35 [Google Scholar]
- Aerts, C., Augustson, K., Mathis, S., et al. 2021, A&A, 656, A121 [NASA ADS] [CrossRef] [EDP Sciences] [Google Scholar]
- Aerts, C., Van Reeth, T., Mombarg, J. S. G., & Hey, D. 2025, A&A, 695, A214 [NASA ADS] [CrossRef] [EDP Sciences] [Google Scholar]
- Asplund, M., Grevesse, N., Sauval, A. J., & Scott, P. 2009, ARA&A, 47, 481 [NASA ADS] [CrossRef] [Google Scholar]
- Balona, L. A., Krisciunas, K., & Cousins, A. W. J. 1994, MNRAS, 270, 905 [NASA ADS] [CrossRef] [Google Scholar]
- Balona, L. A., Joshi, S., Joshi, Y. C., & Sagar, R. 2013, MNRAS, 429, 1466 [CrossRef] [Google Scholar]
- Bedding, T. R., Murphy, S. J., Crawford, C., et al. 2023, ApJ, 946, L10 [NASA ADS] [CrossRef] [Google Scholar]
- Bildsten, L., Ushomirsky, G., & Cutler, C. 1996, ApJ, 460, 827 [NASA ADS] [CrossRef] [Google Scholar]
- Bonaca, A., Tanner, J. D., Basu, S., et al. 2012, ApJ, 755, L12 [NASA ADS] [CrossRef] [Google Scholar]
- Bouabid, M. P., Dupret, M. A., Salmon, S., et al. 2013, MNRAS, 429, 2500 [Google Scholar]
- Brogaard, K., Arentoft, T., Miglio, A., et al. 2023, A&A, 679, A23 [NASA ADS] [CrossRef] [EDP Sciences] [Google Scholar]
- Calcaferro, L. M., Córsico, A. H., Uzundag, M., et al. 2024, A&A, 691, A194 [NASA ADS] [CrossRef] [EDP Sciences] [Google Scholar]
- Cantat-Gaudin, T., Anders, F., Castro-Ginard, A., et al. 2020, A&A, 640, A1 [NASA ADS] [CrossRef] [EDP Sciences] [Google Scholar]
- Casagrande, L., & VandenBerg, D. A. 2018, MNRAS, 479, L102 [NASA ADS] [CrossRef] [Google Scholar]
- Chaboyer, B., & Zahn, J. P. 1992, A&A, 253, 173 [NASA ADS] [Google Scholar]
- Choi, J., Dotter, A., Conroy, C., et al. 2016, ApJ, 823, 102 [Google Scholar]
- Cinquegrana, G. C., & Joyce, M. 2022, Res. Notes Am. Astron. Soc., 6, 77 [Google Scholar]
- Claret, A., & Torres, G. 2019, ApJ, 876, 134 [Google Scholar]
- Corsaro, E., Stello, D., Huber, D., et al. 2012, ApJ, 757, 190 [Google Scholar]
- Cox, J. P., & Giuli, R. T. 1968, Principles of Stellar Structure (New York: Gordon and Breach) [Google Scholar]
- Danielski, C., Babusiaux, C., Ruiz-Dern, L., Sartoretti, P., & Arenou, F. 2018, A&A, 614, A19 [NASA ADS] [CrossRef] [EDP Sciences] [Google Scholar]
- De Cat, P., & Aerts, C. 2002, A&A, 393, 965 [NASA ADS] [CrossRef] [EDP Sciences] [Google Scholar]
- Deheuvels, S., & Michel, E. 2011, A&A, 535, A91 [NASA ADS] [CrossRef] [EDP Sciences] [Google Scholar]
- Deheuvels, S., Brandão, I., Silva Aguirre, V., et al. 2016, A&A, 589, A93 [NASA ADS] [CrossRef] [EDP Sciences] [Google Scholar]
- Deheuvels, S., Li, G., Ballot, J., & Lignières, F. 2023, A&A, 670, L16 [NASA ADS] [CrossRef] [EDP Sciences] [Google Scholar]
- Delchambre, L., Bailer-Jones, C. A. L., Bellas-Velidis, I., et al. 2023, A&A, 674, A31 [NASA ADS] [CrossRef] [EDP Sciences] [Google Scholar]
- Dhouib, H., Mathis, S., Bugnet, L., Van Reeth, T., & Aerts, C. 2022, A&A, 661, A133 [NASA ADS] [CrossRef] [EDP Sciences] [Google Scholar]
- Dotter, A. 2016, ApJS, 222, 8 [Google Scholar]
- Dotter, A., Chaboyer, B., Jevremović, D., et al. 2008, ApJS, 178, 89 [Google Scholar]
- Dupret, M. A., Grigahcène, A., Garrido, R., Gabriel, M., & Scuflaire, R. 2005, A&A, 435, 927 [NASA ADS] [CrossRef] [EDP Sciences] [Google Scholar]
- Edelmann, P. V. F., Ratnasingam, R. P., Pedersen, M. G., et al. 2019, ApJ, 876, 4 [NASA ADS] [CrossRef] [Google Scholar]
- Eggenberger, P., Meynet, G., Maeder, A., et al. 2008, Ap&SS, 316, 43 [Google Scholar]
- Eggenberger, P., Moyano, F. D., & den Hartogh, J. W. 2022, A&A, 664, L16 [NASA ADS] [CrossRef] [EDP Sciences] [Google Scholar]
- Ekström, S., Georgy, C., Eggenberger, P., et al. 2012, A&A, 537, A146 [Google Scholar]
- Endal, A. S., & Sofia, S. 1976, ApJ, 210, 184 [NASA ADS] [CrossRef] [Google Scholar]
- Endal, A. S., & Sofia, S. 1978, ApJ, 220, 279 [NASA ADS] [CrossRef] [Google Scholar]
- Espinosa Lara, F., & Rieutord, M. 2011, A&A, 533, A43 [NASA ADS] [CrossRef] [EDP Sciences] [Google Scholar]
- Fitzpatrick, E. L., Massa, D., Gordon, K. D., Bohlin, R., & Clayton, G. C. 2019, ApJ, 886, 108 [Google Scholar]
- Foreman-Mackey, D., Hogg, D. W., Lang, D., & Goodman, J. 2013, PASP, 125, 306 [Google Scholar]
- Fritzewski, D. J., Van Reeth, T., Aerts, C., et al. 2024, A&A, 681, A13 [NASA ADS] [CrossRef] [EDP Sciences] [Google Scholar]
- Fuller, J., Cantiello, M., Stello, D., Garcia, R. A., & Bildsten, L. 2015, Science, 350, 423 [Google Scholar]
- Fuller, J., Piro, A. L., & Jermyn, A. S. 2019, MNRAS, 485, 3661 [NASA ADS] [Google Scholar]
- Gaia Collaboration (De Ridder, J., et al.) 2023, A&A, 674, A36 [CrossRef] [EDP Sciences] [Google Scholar]
- Georgy, C., Ekström, S., Granada, A., et al. 2013, A&A, 553, A24 [NASA ADS] [CrossRef] [EDP Sciences] [Google Scholar]
- Gruberbauer, M., Guenther, D. B., & Kallinger, T. 2012, ApJ, 749, 109 [CrossRef] [Google Scholar]
- Guinan, E. F., Ribas, I., Fitzpatrick, E. L., et al. 2000, ApJ, 544, 409 [NASA ADS] [CrossRef] [Google Scholar]
- Guo, Z., Gies, D. R., & Matson, R. A. 2017, ApJ, 851, 39 [NASA ADS] [CrossRef] [Google Scholar]
- Guo, Z., Fuller, J., Shporer, A., et al. 2019, ApJ, 885, 46 [Google Scholar]
- Hatt, E. J., Ong, J. M. J., Nielsen, M. B., et al. 2024, MNRAS, 534, 1060 [NASA ADS] [CrossRef] [Google Scholar]
- Heger, A., Langer, N., & Woosley, S. E. 2000, ApJ, 528, 368 [NASA ADS] [CrossRef] [Google Scholar]
- Heger, A., Woosley, S. E., & Spruit, H. C. 2005, ApJ, 626, 350 [Google Scholar]
- Herwig, F. 2000, A&A, 360, 952 [NASA ADS] [Google Scholar]
- Herwig, F., Woodward, P. R., Mao, H., et al. 2023, MNRAS, 525, 1601 [NASA ADS] [CrossRef] [Google Scholar]
- Horst, L., Edelmann, P. V. F., Andrássy, R., et al. 2020, A&A, 641, A18 [NASA ADS] [CrossRef] [EDP Sciences] [Google Scholar]
- Huber, D. 2015, in Giants of Eclipse: The ζ Aurigae Stars and Other Binary Systems, eds. T. B. Ake, & E. Griffin, Astrophys. Space Sci. Lib., 408, 169 [Google Scholar]
- Hunt, E. L., & Reffert, S. 2024, A&A, 686, A42 [NASA ADS] [CrossRef] [EDP Sciences] [Google Scholar]
- Jermyn, A. S., Bauer, E. B., Schwab, J., et al. 2023, ApJS, 265, 15 [NASA ADS] [CrossRef] [Google Scholar]
- Johnston, C. 2021, A&A, 655, A29 [NASA ADS] [CrossRef] [EDP Sciences] [Google Scholar]
- Johnston, C., Aerts, C., Pedersen, M. G., & Bastian, N. 2019a, A&A, 632, A74 [EDP Sciences] [Google Scholar]
- Johnston, C., Tkachenko, A., Aerts, C., et al. 2019b, MNRAS, 482, 1231 [Google Scholar]
- Joyce, M., & Chaboyer, B. 2018a, ApJ, 864, 99 [NASA ADS] [CrossRef] [Google Scholar]
- Joyce, M., & Chaboyer, B. 2018b, ApJ, 856, 10 [Google Scholar]
- Joyce, M., & Tayar, J. 2023, Galaxies, 11, 75 [NASA ADS] [CrossRef] [Google Scholar]
- Kaye, A. B., Handler, G., Krisciunas, K., Poretti, E., & Zerbi, F. M. 1999, PASP, 111, 840 [Google Scholar]
- Keen, M. A., Bedding, T. R., Murphy, S. J., et al. 2015, MNRAS, 454, 1792 [Google Scholar]
- Kemp, A., Fritzewski, D. J., Van Reeth, T., et al. 2025, A&A, 693, A184 [NASA ADS] [CrossRef] [EDP Sciences] [Google Scholar]
- Kerr, R., Kraus, A. L., Murphy, S. J., et al. 2022a, ApJ, 941, 143 [NASA ADS] [CrossRef] [Google Scholar]
- Kerr, R., Kraus, A. L., Murphy, S. J., et al. 2022b, ApJ, 941, 49 [NASA ADS] [CrossRef] [Google Scholar]
- Kippenhahn, R., & Weigert, A. 1994, Stellar Structure and Evolution (Berlin Heidelberg New York: Springer-Verlag) [Google Scholar]
- Kurucz, R. L. 2005, Mem. Soc. Astron. It. Suppl., 8, 14 [Google Scholar]
- Lagarde, N., Decressin, T., Charbonnel, C., et al. 2012, A&A, 543, A108 [NASA ADS] [CrossRef] [EDP Sciences] [Google Scholar]
- Langer, N. 1992, A&A, 265, L17 [NASA ADS] [Google Scholar]
- Lee, U., & Saio, H. 1997, ApJ, 491, 839 [Google Scholar]
- Li, Y., Bedding, T. R., Li, T., et al. 2018, MNRAS, 476, 470 [Google Scholar]
- Li, G., Van Reeth, T., Bedding, T. R., Murphy, S. J., & Antoci, V. 2019, MNRAS, 487, 782 [Google Scholar]
- Li, G., Guo, Z., Fuller, J., et al. 2020a, MNRAS, 497, 4363 [Google Scholar]
- Li, G., Van Reeth, T., Bedding, T. R., et al. 2020b, MNRAS, 491, 3586 [Google Scholar]
- Li, G., Deheuvels, S., Ballot, J., & Lignières, F. 2022, Nature, 610, 43 [NASA ADS] [CrossRef] [Google Scholar]
- Li, G., Deheuvels, S., Li, T., Ballot, J., & Lignières, F. 2023, A&A, 680, A26 [NASA ADS] [CrossRef] [EDP Sciences] [Google Scholar]
- Li, G., Aerts, C., Bedding, T. R., et al. 2024, A&A, 686, A142 [NASA ADS] [CrossRef] [EDP Sciences] [Google Scholar]
- Lignières, F., Ballot, J., Deheuvels, S., & Galoy, M. 2024, A&A, 683, A2 [NASA ADS] [CrossRef] [EDP Sciences] [Google Scholar]
- Lindsay, C. J., Ong, J. M. J., & Basu, S. 2024, ApJ, 965, 171 [Google Scholar]
- Maeder, A. 1987, A&A, 178, 159 [NASA ADS] [Google Scholar]
- Maeder, A. 2009, Physics, Formation and Evolution of Rotating Stars (Heidelberg: Springer-Verlag) [Google Scholar]
- Magic, Z., Serenelli, A., Weiss, A., & Chaboyer, B. 2010, ApJ, 718, 1378 [NASA ADS] [CrossRef] [Google Scholar]
- Markova, N., Puls, J., & Langer, N. 2018, A&A, 613, A12 [NASA ADS] [CrossRef] [EDP Sciences] [Google Scholar]
- Martins, F., Depagne, E., Russeil, D., & Mahy, L. 2013, A&A, 554, A23 [NASA ADS] [CrossRef] [EDP Sciences] [Google Scholar]
- Mathis, S. 2013, in Lecture Notes in Physics, eds. M. Goupil, K. Belkacem, C. Neiner, F. Lignières, & J. J. Green (Berlin Springer Verlag), 865, 23 [CrossRef] [Google Scholar]
- Maxted, P. F. L., Gaulme, P., Graczyk, D., et al. 2020, MNRAS, 498, 332 [Google Scholar]
- Meingast, S., Alves, J., & Rottensteiner, A. 2021, A&A, 645, A84 [NASA ADS] [CrossRef] [EDP Sciences] [Google Scholar]
- Metcalfe, T. S., Chaplin, W. J., Appourchaux, T., et al. 2012, ApJ, 748, L10 [Google Scholar]
- Metcalfe, T. S., Creevey, O. L., & Davies, G. R. 2015, ApJ, 811, L37 [NASA ADS] [CrossRef] [Google Scholar]
- Meynet, G., & Maeder, A. 1997, A&A, 321, 465 [NASA ADS] [Google Scholar]
- Michielsen, M., Pedersen, M. G., Augustson, K. C., Mathis, S., & Aerts, C. 2019, A&A, 628, A76 [NASA ADS] [CrossRef] [EDP Sciences] [Google Scholar]
- Michielsen, M., Aerts, C., & Bowman, D. M. 2021, A&A, 650, A175 [NASA ADS] [CrossRef] [EDP Sciences] [Google Scholar]
- Michielsen, M., Van Reeth, T., Tkachenko, A., & Aerts, C. 2023, A&A, 679, A6 [NASA ADS] [CrossRef] [EDP Sciences] [Google Scholar]
- Miglio, A., Montalbán, J., Noels, A., & Eggenberger, P. 2008, MNRAS, 386, 1487 [Google Scholar]
- Miglio, A., Chaplin, W. J., Brogaard, K., et al. 2016, MNRAS, 461, 760 [NASA ADS] [CrossRef] [Google Scholar]
- Mombarg, J. S. G. 2023, A&A, 677, A63 [NASA ADS] [CrossRef] [EDP Sciences] [Google Scholar]
- Mombarg, J. S. G., Van Reeth, T., Pedersen, M. G., et al. 2019, MNRAS, 485, 3248 [NASA ADS] [CrossRef] [Google Scholar]
- Mombarg, J. S. G., Van Reeth, T., & Aerts, C. 2021, A&A, 650, A58 [NASA ADS] [CrossRef] [EDP Sciences] [Google Scholar]
- Mombarg, J. S. G., Rieutord, M., & Espinosa Lara, F. 2023, A&A, 677, L5 [NASA ADS] [CrossRef] [EDP Sciences] [Google Scholar]
- Mombarg, J. S. G., Aerts, C., & Molenberghs, G. 2024a, A&A, 685, A21 [NASA ADS] [CrossRef] [EDP Sciences] [Google Scholar]
- Mombarg, J. S. G., Aerts, C., Van Reeth, T., & Hey, D. 2024b, A&A, 691, A131 [NASA ADS] [CrossRef] [EDP Sciences] [Google Scholar]
- Moravveji, E., Aerts, C., Pápics, P. I., Triana, S. A., & Vandoren, B. 2015, A&A, 580, A27 [NASA ADS] [CrossRef] [EDP Sciences] [Google Scholar]
- Mowlavi, N., Barblan, F., Saesen, S., & Eyer, L. 2013, A&A, 554, A108 [NASA ADS] [CrossRef] [EDP Sciences] [Google Scholar]
- Moyano, F. D., Eggenberger, P., Salmon, S. J. A. J., Mombarg, J. S. G., & Ekström, S. 2023, A&A, 677, A6 [NASA ADS] [CrossRef] [EDP Sciences] [Google Scholar]
- Murphy, S. J. 2025, Contrib. Astron. Obs. Skalnate Pleso, 55, 122 [Google Scholar]
- Murphy, S. J., Saio, H., Takada-Hidai, M., et al. 2020, MNRAS, 498, 4272 [NASA ADS] [CrossRef] [Google Scholar]
- Murphy, S. J., Bedding, T. R., Gautam, A., Kerr, R. P., & Mani, P. 2024, MNRAS, 534, 3022 [Google Scholar]
- Neilson, H. R., Cantiello, M., & Langer, N. 2011, A&A, 529, L9 [NASA ADS] [CrossRef] [EDP Sciences] [Google Scholar]
- Nguyen, C. T., Costa, G., Girardi, L., et al. 2022, A&A, 665, A126 [NASA ADS] [CrossRef] [EDP Sciences] [Google Scholar]
- Nieva, M. F., & Przybilla, N. 2012, A&A, 539, A143 [NASA ADS] [CrossRef] [EDP Sciences] [Google Scholar]
- Noll, A., & Deheuvels, S. 2023, A&A, 676, A70 [NASA ADS] [CrossRef] [EDP Sciences] [Google Scholar]
- Noll, A., Deheuvels, S., & Ballot, J. 2021, A&A, 647, A187 [EDP Sciences] [Google Scholar]
- Ouazzani, R. M., Marques, J. P., Goupil, M. J., et al. 2019, A&A, 626, A121 [NASA ADS] [CrossRef] [EDP Sciences] [Google Scholar]
- Paxton, B., Bildsten, L., Dotter, A., et al. 2011, ApJS, 192, 3 [Google Scholar]
- Paxton, B., Cantiello, M., Arras, P., et al. 2013, ApJS, 208, 4 [Google Scholar]
- Paxton, B., Marchant, P., Schwab, J., et al. 2015, ApJS, 220, 15 [Google Scholar]
- Paxton, B., Schwab, J., Bauer, E. B., et al. 2018, ApJS, 234, 34 [NASA ADS] [CrossRef] [Google Scholar]
- Paxton, B., Smolec, R., Schwab, J., et al. 2019, ApJS, 243, 10 [Google Scholar]
- Pedersen, M. G. 2022, ApJ, 930, 94 [NASA ADS] [CrossRef] [Google Scholar]
- Pedersen, M. G., Aerts, C., Pápics, P. I., & Rogers, T. M. 2018, A&A, 614, A128 [NASA ADS] [CrossRef] [EDP Sciences] [Google Scholar]
- Pedersen, M. G., Aerts, C., Pápics, P. I., et al. 2021, Nat. Astron., 5, 715 [NASA ADS] [CrossRef] [Google Scholar]
- Planck Collaboration XIII. 2016, A&A, 594, A13 [NASA ADS] [CrossRef] [EDP Sciences] [Google Scholar]
- Potter, A. T., Tout, C. A., & Eldridge, J. J. 2012, MNRAS, 419, 748 [NASA ADS] [CrossRef] [Google Scholar]
- Ratnasingam, R. P., Rogers, T. M., Chowdhury, S., et al. 2023, A&A, 674, A134 [NASA ADS] [CrossRef] [EDP Sciences] [Google Scholar]
- Rauer, H., Aerts, C., Cabrera, J., et al. 2025, Exp. Astron., 59, 26 [Google Scholar]
- Reyes, C., Stello, D., Hon, M., et al. 2024, MNRAS, 532, 2860 [NASA ADS] [CrossRef] [Google Scholar]
- Reyes, C., Stello, D., Hon, M., et al. 2025, MNRAS, 538, 1720 [Google Scholar]
- Ricker, G. R., Winn, J. N., Vanderspek, R., et al. 2015, J. Astron. Telesc. Instrum. Syst., 1, 014003 [Google Scholar]
- Riello, M., De Angeli, F., Evans, D. W., et al. 2021, A&A, 649, A3 [NASA ADS] [CrossRef] [EDP Sciences] [Google Scholar]
- Rieutord, M., Espinosa Lara, F., & Putigny, B. 2016, J. Comput. Phys., 318, 277 [NASA ADS] [CrossRef] [Google Scholar]
- Rogers, T. M., & Ratnasingam, R. P. 2025, ApJ, 983, L38 [Google Scholar]
- Rui, N. Z., Ong, J. M. J., & Mathis, S. 2024, MNRAS, 527, 6346 [Google Scholar]
- Saio, H., Bedding, T. R., Kurtz, D. W., et al. 2018a, MNRAS, 477, 2183 [Google Scholar]
- Saio, H., Kurtz, D. W., Murphy, S. J., Antoci, V. L., & Lee, U. 2018b, MNRAS, 474, 2774 [Google Scholar]
- Sandquist, E. L., Latham, D. W., Mathieu, R. D., et al. 2021, AJ, 161, 59 [NASA ADS] [CrossRef] [Google Scholar]
- Schmid, V. S., & Aerts, C. 2016, A&A, 592, A116 [NASA ADS] [CrossRef] [EDP Sciences] [Google Scholar]
- Schmid, V. S., Tkachenko, A., Aerts, C., et al. 2015, A&A, 584, A35 [NASA ADS] [CrossRef] [EDP Sciences] [Google Scholar]
- Schneider, F. R. N., Langer, N., de Koter, A., et al. 2014, A&A, 570, A66 [NASA ADS] [CrossRef] [EDP Sciences] [Google Scholar]
- Sekaran, S., Tkachenko, A., Abdul-Masih, M., et al. 2020, A&A, 643, A162 [EDP Sciences] [Google Scholar]
- Sekaran, S., Tkachenko, A., Johnston, C., & Aerts, C. 2021, A&A, 648, A91 [NASA ADS] [CrossRef] [EDP Sciences] [Google Scholar]
- Spruit, H. C. 2002, A&A, 381, 923 [CrossRef] [EDP Sciences] [Google Scholar]
- Stello, D., Cantiello, M., Fuller, J., et al. 2016a, Nature, 529, 364 [Google Scholar]
- Stello, D., Vanderburg, A., Casagrande, L., et al. 2016b, ApJ, 832, 133 [NASA ADS] [CrossRef] [Google Scholar]
- Sun, M., Townsend, R. H. D., & Guo, Z. 2023, ApJ, 945, 43 [NASA ADS] [CrossRef] [Google Scholar]
- Sung, H., Bessell, M. S., Lee, B.-W., & Lee, S.-G. 2002, AJ, 123, 290 [NASA ADS] [CrossRef] [Google Scholar]
- Szewczuk, W., & Daszyńska-Daszkiewicz, J. 2017, MNRAS, 469, 13 [NASA ADS] [CrossRef] [Google Scholar]
- Tailo, M., Corsaro, E., Miglio, A., et al. 2022, A&A, 662, L7 [NASA ADS] [CrossRef] [EDP Sciences] [Google Scholar]
- Tayar, J., & Joyce, M. 2025, ApJ, 984, L56 [Google Scholar]
- Tayar, J., Somers, G., Pinsonneault, M. H., et al. 2017, ApJ, 840, 17 [NASA ADS] [CrossRef] [Google Scholar]
- Temaj, D., Schneider, F. R. N., Laplace, E., Wei, D., & Podsiadlowski, P. 2024, A&A, 682, A123 [NASA ADS] [CrossRef] [EDP Sciences] [Google Scholar]
- Thompson, W., Herwig, F., Woodward, P. R., et al. 2024, MNRAS, 531, 1316 [NASA ADS] [CrossRef] [Google Scholar]
- Tkachenko, A., Degroote, P., Aerts, C., et al. 2014, MNRAS, 438, 3093 [Google Scholar]
- Tkachenko, A., Pavlovski, K., Johnston, C., et al. 2020, A&A, 637, A60 [NASA ADS] [CrossRef] [EDP Sciences] [Google Scholar]
- Townsend, R. H. D. 2003, MNRAS, 340, 1020 [Google Scholar]
- Townsend, R. H. D., & Teitler, S. A. 2013, MNRAS, 435, 3406 [Google Scholar]
- Townsend, R. H. D., Goldstein, J., & Zweibel, E. G. 2018, MNRAS, 475, 879 [Google Scholar]
- Van Reeth, T., Tkachenko, A., & Aerts, C. 2016, A&A, 593, A120 [NASA ADS] [CrossRef] [EDP Sciences] [Google Scholar]
- Van Reeth, T., Mombarg, J. S. G., Mathis, S., et al. 2018, A&A, 618, A24 [NASA ADS] [EDP Sciences] [Google Scholar]
- Vanlaer, V., Aerts, C., Bellinger, E. P., & Christensen-Dalsgaard, J. 2023, A&A, 675, A17 [NASA ADS] [CrossRef] [EDP Sciences] [Google Scholar]
- Vanon, R., Edelmann, P. V. F., Ratnasingam, R. P., Varghese, A., & Rogers, T. M. 2023, ApJ, 954, 171 [Google Scholar]
- Varghese, A., Ratnasingam, R. P., Vanon, R., Edelmann, P. V. F., & Rogers, T. M. 2023, ApJ, 942, 53 [NASA ADS] [CrossRef] [Google Scholar]
- Varghese, A., Ratnasingam, R. P., Vanon, R., et al. 2024, ApJ, 970, 104 [Google Scholar]
- Verma, K., Raodeo, K., Basu, S., et al. 2019, MNRAS, 483, 4678 [Google Scholar]
- Viani, L. S., & Basu, S. 2020, ApJ, 904, 22 [NASA ADS] [CrossRef] [Google Scholar]
- Viani, L. S., Basu, S., Ong, J. M. J., Bonaca, A., & Chaplin, W. J. 2018, ApJ, 858, 28 [NASA ADS] [CrossRef] [Google Scholar]
- von Zeipel, H. 1924, MNRAS, 84, 665 [NASA ADS] [CrossRef] [Google Scholar]
- Waelkens, C. 1991, A&A, 246, 453 [NASA ADS] [Google Scholar]
- Weidner, C., & Vink, J. S. 2010, A&A, 524, A98 [NASA ADS] [CrossRef] [EDP Sciences] [Google Scholar]
- White, T. R., Benomar, O., Silva Aguirre, V., et al. 2017, A&A, 601, A82 [NASA ADS] [CrossRef] [EDP Sciences] [Google Scholar]
- Zahn, J. P. 1992, A&A, 265, 115 [NASA ADS] [Google Scholar]
- Zhang, X. B., Fu, J. N., Luo, C. Q., Ren, A. B., & Yan, Z. Z. 2018, ApJ, 865, 115 [Google Scholar]
Appendix A: Impact of mixing length αMLT
Aerts et al. (2018) studied the impact of changing the input physics for gravito-inertial asteroseismology, including the mixing length parameter. They offered a hierarchy in the importance of various phenomena. They found that changing the mixing length parameter hardly matters for stars with a radiative envelope, but it is of relevance for AF-type pulsators due to their thin convective envelope. However, adopting a meaningful range in values for the mixing length parameter was found to be inferior in importance compared to the inclusion of the Coriolis force.
To investigate the actual impact of different values of the mixing length parameter αMLT for our application, we recalculated the best-fitting evolutionary tracks for the two stars TIC 308307454 and TIC 281582674 using αMLT = 2.0. For the model of TIC 308307454, we adopted M = 1.54 M⊙, fCBM = 0.005, and η = 1000, while for TIC 281582674 we adopted M = 1.78 M⊙, fCBM = 0.030, and η = 1000. Both models were evolved up to an age of 300 Myr.
Figure A.1 shows the evolutionary tracks of TIC 308307454 at the beginning of the main sequence. As the star still has a shallow convective envelope, we note that a lower αMLT value shifts the evolutionary track towards lower temperatures, consistent with what Joyce & Tayar (2023) reported using both MESA and the DSEP (Dartmouth Stellar Evolution Program, Dotter et al. 2008) code. This temperature shift (∼6 K) is negligible compared with the observational uncertainties.
Figure A.2 displays the evolution of the asymptotic spacing Π0 as a function of time. We find that a lower αMLT value leads to a decrease in Π0. This downward shift (∼10 s) is negligible compared with observational uncertainties, confirming that αMLT does not strongly affect the convective core. Figure A.3 compares the period-spacing patterns of the models with αMLT = 1.8 and 2.0. We find that the two models produce nearly identical period spacings. Therefore, varying αMLT does not introduce any significant changes in our modelling.
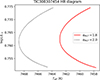 |
Fig. A.1. HR diagram showing the evolutionary tracks of the best-fitting model of TIC 308307454 computed with different values of the mixing length parameter αMLT. |
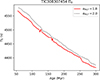 |
Fig. A.2. Evolution of the asymptotic period spacing Π0 with stellar age for the best-fitting model of TIC 308307454, using different αMLT. |
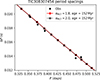 |
Fig. A.3. Period-spacing patterns of the best-fitting model of TIC 308307454 for different values of αMLT. The g-mode periods are nearly identical, such that the red and gray points overlap. |
As shown in Fig. A.4, the evolutionary tracks on the HR diagram for TIC 281582674 exhibit even smaller differences than in Fig. A.1, because it has a higher mass and a thinner convective envelope. For the evolution of Π0 (Fig. A.5), we find that a lower αMLT increases Π0, in contrast to the trend seen in Fig. A.2. When inspecting the period spacing pattern of TIC 281582674’s models with different values of αMLT, we find that adopting αMLT = 1.8 shifts the time at which the dip appears, requiring an older age to reproduce the observed dip. Varying αMLT slightly alters the internal structure and these structural changes may impact the modes in a variety of ways, depending on the nature of the core (growing or shrinking) and the thickness of the convective envelope. Some modes are hardly affected while others are quite sensitive to changes in the mode cavity. This notably matters for trapped modes, as they are dependent on the structure in the boundary layer between the convective core and the radiative envelope (e.g. Miglio et al. 2008; Michielsen et al. 2021; Vanlaer et al. 2023). We have not investigated the relation or degeneracy between αMLT and the other parameters because TIC 281582674 reveals only one tiny dip.
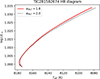 |
Fig. A.4. HR diagram showing the evolutionary tracks of the best-fitting model of TIC 281582674 computed with different values of the mixing length parameter αMLT. |
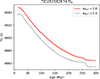 |
Fig. A.5. Evolution of the asymptotic period spacing Π0 with stellar age for the best-fitting model of TIC 281582674, using different αMLT. |
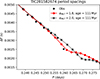 |
Fig. A.6. Period-spacing patterns of the best-fitting model of TIC 281582674 for different values of αMLT. |
Appendix B: Fitting results for TIC 358466729 and TIC 410452218 using Approach 1
Here we present the posterior distributions and best-fitting period spacing patterns of TIC 358466729 and TIC 410452218 obtained using Approach 1. These two stars have limited ability to constrain age and other stellar parameters, as Π0 evolves slowly with time in their mass ranges and no clear dips are observed in their period spacing patterns. TIC 358466729 exhibits Rossby modes with k = −2 and m = −1 (Saio et al. 2018b; Li et al. 2019).
Appendix C: Fitting results using Approach 2
In contrast to Approach 1 shown above, Approach 2 imposes that all four stars share the same age, which is more consistent with the condition of open clusters. We present the posterior distributions and the best-fitting period spacing patterns here.
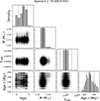 |
Fig. C.1. Same as Fig. 2 for TIC 308307454, but using Approach 2. The bottom-right panel shows the distributions of the joint age derived using Approach 2, so this panel is identical in Figs. C.3, C.5, and C.7. |
All Tables
Isochrone-derived observational constraints for the effective temperatures, luminosities, and masses of the six γ Dor stars in NGC 2516.
All Figures
|
Fig. 1. Isochrone-derived luminosities and effective temperatures of the selected γ Dor stars in NGC 2516. The error bars show the 1σ level of the uncertainties. The solid curve is the best-fitting MIST isochrone. |
| In the text | |
|
Fig. 2. Posterior distributions of the model parameters for TIC 308307454 obtained using Approach 1. The diagonal panels show the marginalised 1D distributions for each parameter, where the solid and dashed vertical lines indicate the median and the ±1σ range, respectively. The off-diagonal panels display the 2D joint posterior distributions. We added random noise to the discrete samples for clarity. |
| In the text | |
|
Fig. 3. Observed and best-fitting period spacing pattern of TIC 308307454 from Approach 1. The vertical grey lines indicate the observed g-mode periods, and their period spacings are shown as red crosses. We randomly selected 30 period-spacing patterns from the MCMC result computed with GYRE, shown as circles, with the colour bar indicating the value of fCBM. |
| In the text | |
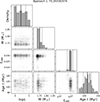 |
Fig. 4. Same as Fig. 2, but for TIC 281582674. |
| In the text | |
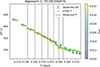 |
Fig. 5. Same as Fig. 3, but for TIC 281582674. |
| In the text | |
|
Fig. 6. Convective mixing parameter fCBM as a function of mass by Approach 1. The red points and their error bars represent the four g-mode pulsators analysed in this work. The translucent markers indicate results from previous studies. |
| In the text | |
|
Fig. 7. Seismic age estimates for the four g-mode stars in NGC 2516. The stars are vertically ordered by increasing Gaia colour index GBP − GRP. Horizontal error bars indicate the individual seismic ages derived using Approach 1. The vertical grey line and the grey shaded region mark the seismic age and ±1σ range obtained from joint modelling of all the four stars using Approach 2 (“Seismic joint fitting”). The vertical blue shaded region represents the MIST isochrone age derived from CMD fitting. The vertical gold shaded region represents the age derived using our own isochrone deduced from the seismic model grid, see Section 5. |
| In the text | |
|
Fig. 8. Asymptotic spacing Π0 as a function of age, for models with different initial rotation rates and overshooting parameters. The left, middle, and right panels correspond to initial rotation rates of Ω/Ωcrit, i = 0.167, 0.333, and 0.5, respectively. The mixing parameter η is fixed at 1 in all models. Each set of curves shows evolutionary tracks for different stellar masses with two overshoot values: fCBM = 0.005 (solid lines) and fCBM = 0.025 (dashed lines). Masses for the dotted curves (fCBM = 0.025) are indicated to the left of each line, while those for the solid curves (fCBM = 0.005) are placed to the right. |
| In the text | |
|
Fig. 9. Asymptotic period spacing Π0 as a function of stellar age for models with fixed initial rotation vi/vi, init = 0.5, fCBM = 0.025, logη = 3, but different initial masses. The horizontal shaded regions indicate the observed Π0 values (and uncertainties) for TIC 372912679 and TIC 308992761. |
| In the text | |
|
Fig. 10. Results of our self-constructed isochrone fitting for various combinations of convective boundary mixing and envelope mixing efficiency, as a function of initial rotation fraction vi/vi, crit. The legend at the top indicates the different combinations of η (envelope mixing parameter) and fCBM (convective boundary mixing). Symbols of the same colour share the same value of fCBM, while different colours correspond to different values of η. The data points are artificially shifted to avoid overlapping. Left: the Gaia extinction parameter A0 as a function of initial rotation fraction. Middle: the best-fitting cluster age as a function of rotation. Right: the log-likelihood of the best-fitting isochrone. Error bars indicate 1σ confidence intervals. |
| In the text | |
|
Fig. 11. Best-fitting result of the self-constructed isochrone with η = 10, fCBM = 0.025, and vi/vi, crit = 0.5. The red curve represents the best-fitting isochrone, while the grey curves show 20 randomly selected samples from the MCMC chains, showing the uncertainty region. The small grey dots indicate member stars from Meingast et al. (2021), and the black dots are the upper main-sequence stars used as input observables. The modelled g-mode pulsators are marked with light blue squares. |
| In the text | |
|
Fig. 12. Same as Fig. 11, but only showing stars with masses up to 2.0 M⊙. The modelled g-mode pulsators are marked with light blue squares. |
| In the text | |
|
Fig. A.1. HR diagram showing the evolutionary tracks of the best-fitting model of TIC 308307454 computed with different values of the mixing length parameter αMLT. |
| In the text | |
|
Fig. A.2. Evolution of the asymptotic period spacing Π0 with stellar age for the best-fitting model of TIC 308307454, using different αMLT. |
| In the text | |
|
Fig. A.3. Period-spacing patterns of the best-fitting model of TIC 308307454 for different values of αMLT. The g-mode periods are nearly identical, such that the red and gray points overlap. |
| In the text | |
|
Fig. A.4. HR diagram showing the evolutionary tracks of the best-fitting model of TIC 281582674 computed with different values of the mixing length parameter αMLT. |
| In the text | |
|
Fig. A.5. Evolution of the asymptotic period spacing Π0 with stellar age for the best-fitting model of TIC 281582674, using different αMLT. |
| In the text | |
|
Fig. A.6. Period-spacing patterns of the best-fitting model of TIC 281582674 for different values of αMLT. |
| In the text | |
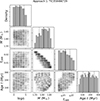 |
Fig. B.1. Same as Fig. 2, but for TIC 358466729. |
| In the text | |
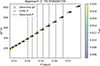 |
Fig. B.2. Same as Fig. 3, but for TIC 358466729. This star exhibit k = −2, m = −1 r modes. |
| In the text | |
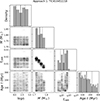 |
Fig. B.3. Same as Fig. 2, but for TIC 410452218. |
| In the text | |
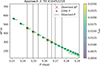 |
Fig. B.4. Same as Fig. 3, but for TIC 410452218. |
| In the text | |
|
Fig. C.1. Same as Fig. 2 for TIC 308307454, but using Approach 2. The bottom-right panel shows the distributions of the joint age derived using Approach 2, so this panel is identical in Figs. C.3, C.5, and C.7. |
| In the text | |
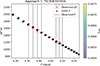 |
Fig. C.2. Same as Fig. 3 for TIC 308307454, but using Approach 2. |
| In the text | |
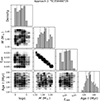 |
Fig. C.3. Same as Fig. 3, but for TIC 358466729 using Approach 2. |
| In the text | |
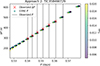 |
Fig. C.4. Same as Fig. 3, but for TIC 358466729 using Approach 2. |
| In the text | |
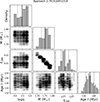 |
Fig. C.5. Same as Fig. 3, but for TIC 410452218 using Approach 2. |
| In the text | |
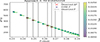 |
Fig. C.6. Same as Fig. 3, but for TIC 410452218 using Approach 2. |
| In the text | |
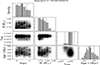 |
Fig. C.7. Same as Fig. 3, but for TIC 281582674 using Approach 2. |
| In the text | |
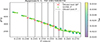 |
Fig. C.8. Same as Fig. 3, but for TIC 281582674 using Approach 2. |
| In the text | |
Current usage metrics show cumulative count of Article Views (full-text article views including HTML views, PDF and ePub downloads, according to the available data) and Abstracts Views on Vision4Press platform.
Data correspond to usage on the plateform after 2015. The current usage metrics is available 48-96 hours after online publication and is updated daily on week days.
Initial download of the metrics may take a while.