Fig. 3.
Download original image
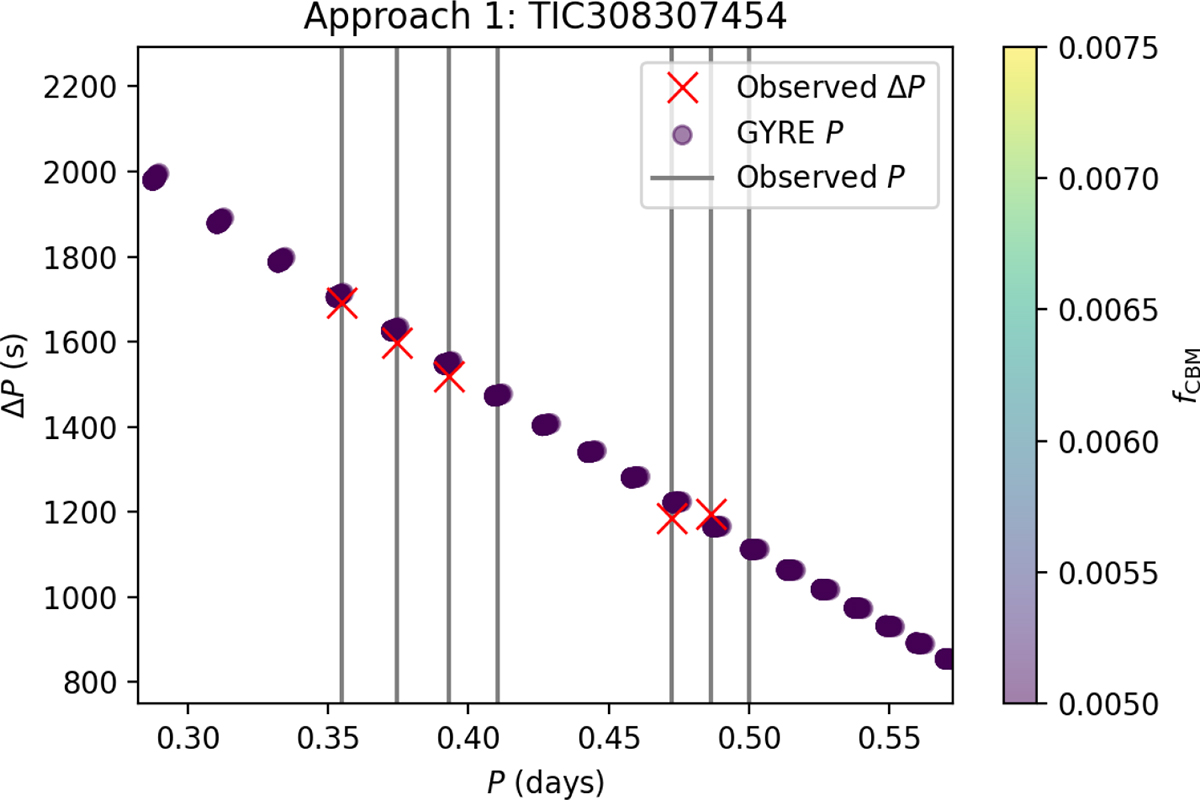
Observed and best-fitting period spacing pattern of TIC 308307454 from Approach 1. The vertical grey lines indicate the observed g-mode periods, and their period spacings are shown as red crosses. We randomly selected 30 period-spacing patterns from the MCMC result computed with GYRE, shown as circles, with the colour bar indicating the value of fCBM.
Current usage metrics show cumulative count of Article Views (full-text article views including HTML views, PDF and ePub downloads, according to the available data) and Abstracts Views on Vision4Press platform.
Data correspond to usage on the plateform after 2015. The current usage metrics is available 48-96 hours after online publication and is updated daily on week days.
Initial download of the metrics may take a while.