Fig. 3.
Download original image
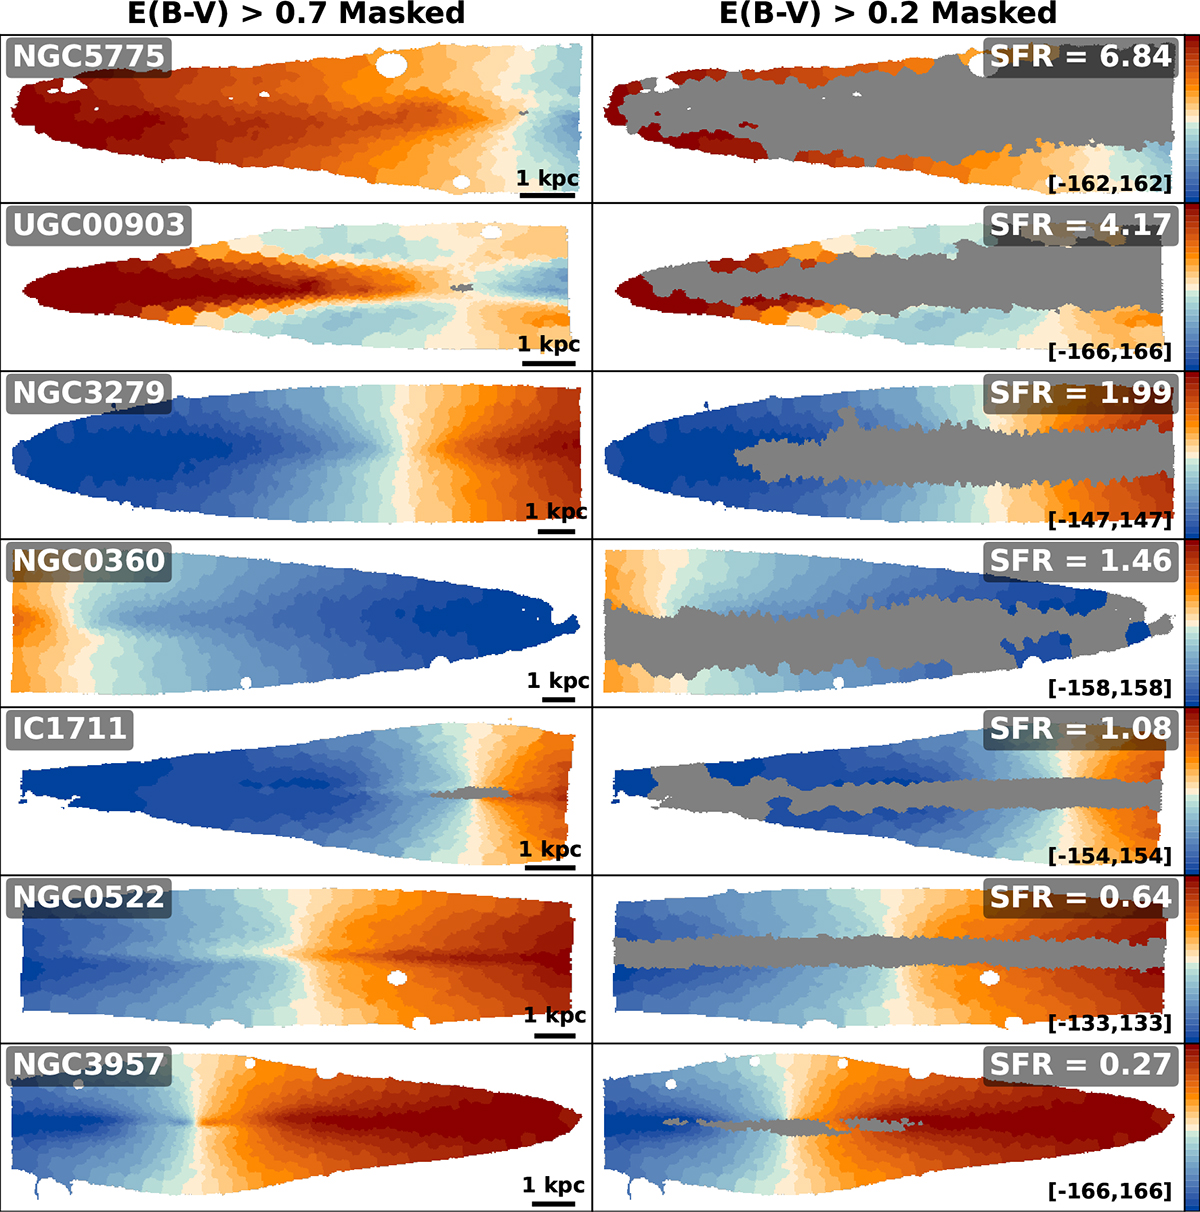
Illustration of masking for two E(B − V) thresholds across our sample, overlaid on the V maps. Each row corresponds to a galaxy, ordered from top to bottom by decreasing star formation rate. The left column shows masks where Voronoi bins with E(B − V) > 0.7 are excluded (greyed out), while the right column shows masks for E(B − V) > 0.2. Galaxies are also labelled with their star formation rates in M⊙ yr−1. We show the range in the velocity colour bar in the bottom right of the right-side panels. Aggressive masking removes most mid-plane bins in highly star-forming galaxies.
Current usage metrics show cumulative count of Article Views (full-text article views including HTML views, PDF and ePub downloads, according to the available data) and Abstracts Views on Vision4Press platform.
Data correspond to usage on the plateform after 2015. The current usage metrics is available 48-96 hours after online publication and is updated daily on week days.
Initial download of the metrics may take a while.