| Issue |
A&A
Volume 703, November 2025
|
|
|---|---|---|
| Article Number | A206 | |
| Number of page(s) | 15 | |
| Section | Extragalactic astronomy | |
| DOI | https://doi.org/10.1051/0004-6361/202556418 | |
| Published online | 21 November 2025 | |
The GECKOS survey: Jeans anisotropic models of edge-on discs uncover the impact of dust and kinematic structures
1
European Southern Observatory, Karl-Schwarzschild-Straße 2, Garching 85748, Germany
2
Sydney Institute for Astronomy, School of Physics, A28, The University of Sydney, NSW 2006, Australia
3
School of Physics, University of New South Wales, NSW 2052, Australia
4
Sub-department of Astrophysics, Department of Physics, University of Oxford, Denys Wilkinson Building, Keble Road, Oxford OX1 3RH, United Kingdom
5
Astrophysics Research Institute, Liverpool John Moores University, 146 Brownlow Hill, Liverpool L3 5RF, United Kingdom
6
Centre for Extragalactic Astronomy, Department of Physics, Durham University, South Road, Durham DH1 3LE, United Kingdom
7
Instituto de Astrofísica de Canarias, Calle Vía Láctea s/n, E-38205 La Laguna, Tenerife, Spain
8
Departamento de Astrofísica, Universidad de La Laguna, Av. del Astrofísico Francisco Sánchez s/n, E-38206 La Laguna, Tenerife, Spain
9
Universitäts-Sternwarte, Fakultät für Physik, Ludwig-Maximilians-Universität München, Scheinerstr. 1, 81679 München, Germany
10
Department of Astrophysics, University of Vienna, Türkenschanzstraße 17, 1180 Vienna, Austria
11
Astrophysics Research Group, University of Surrey, Guildford, Surrey GU2 7XH, United Kingdom
12
Cardiff Hub for Astrophysics Research & Technology, School of Physics & Astronomy, Cardiff University, Queens Buildings, Cardiff CF24 3AA, United Kingdom
13
Centre for Astrophysics and Supercomputing, Swinburne University of Technology, PO Box 218 Hawthorn, VIC 3122, Australia
14
Homer L. Dodge Department of Physics & Astronomy, University of Oklahoma, 440 W. Brooks St, Norman, OK 73019, USA
15
School of Mathematical and Physical Sciences, Macquarie University, NSW 2109, Australia
16
Macquarie University Astrophysics and Space Technologies Research Centre, Sydney, NSW 2109, Australia
17
Space Telescope Science Institute, 3700 San Martin Drive, Baltimore, MD 21218, USA
⋆ Corresponding author: This email address is being protected from spambots. You need JavaScript enabled to view it.
Received:
15
July
2025
Accepted:
9
September
2025
Abstract
The central regions of disc galaxies host a rich variety of stellar structures: nuclear discs, bars, bulges, and boxy-peanut bulges. These components are often difficult to disentangle, both photometrically and kinematically, particularly in star-forming galaxies where dust obscuration and complex stellar motions complicate interpretation. In this work, we used data from the GECKOS-MUSE survey to investigate the impact of dust on axisymmetric Jeans Anisotropic Multi-Gaussian Expansion (JAM) models and assess their ability to recover kinematic structures in edge-on disc galaxies. We constructed JAM models for a sample of seven edge-on (i ⪆ 85°) galaxies that span a range of star formation rates, dust content, and kinematic complexity. We find that when dust is appropriately masked, the disc regions of each galaxy are fit to χreduced2 ≤ 5. We analysed 2D residual velocity fields to identify signatures of non-axisymmetric structure. We find that derived dynamical masses are constant within 10% for each galaxy across all dust masking levels. In NGC 3957, a barred boxy galaxy in our sample, we identified velocity residuals that persist even under aggressive dust masking, aligned with bar orbits and supported by photometric bar signatures. We extended this analysis to reveal a bar in IC 1711 and a possible side-on bar in NGC 0522. Our results highlight both the capabilities and limitations of JAM in dusty, edge-on systems and attempt to link residual velocities to known non-axisymmetric kinematic structure.
Key words: galaxies: evolution / galaxies: general / galaxies: kinematics and dynamics / galaxies: structure
© The Authors 2025
 Open Access article, published by EDP Sciences, under the terms of the Creative Commons Attribution License (https://creativecommons.org/licenses/by/4.0), which permits unrestricted use, distribution, and reproduction in any medium, provided the original work is properly cited.
This article is published in open access under the Subscribe to Open model. This email address is being protected from spambots. You need JavaScript enabled to view it. to support open access publication.
1. Introduction
The evolution of massive disc galaxies in the local Universe, from their formation to the present day, is a significantly complex picture. The ΛCDM (Lambda Cold Dark Matter) paradigm asserts that gas collapse within a dark matter halo and hierarchical structure formation are the processes through which galaxies build up their mass (White & Rees 1978; Steinmetz & Navarro 2002; Abadi et al. 2003; Hopkins et al. 2010), with simulations showing that galaxies experience minor and major mergers over their lifetimes (e.g. Naab et al. 2009; Di Matteo et al. 2009; Lagos et al. 2017; Nevin et al. 2023). Minor mergers (e.g. Choi & Yi 2017; Schulze et al. 2020), major mergers (e.g. Lagos et al. 2022; Rutherford et al. 2024), gas accretion (e.g. Ho 2007; Fraternali & Binney 2008; Ho et al. 2019; Bacchini et al. 2024), stellar feedback (e.g. Übler et al. 2014; Bik et al. 2022), AGN (Active Galactic Nuclei) feedback (e.g. Davies et al. 2020; D’Eugenio et al. 2024), and environmental processes (e.g. Cappellari et al. 2011b; Rutherford et al. 2021) are additionally capable of transforming the stellar motions within a galaxy, primarily through the growth of dispersion-supported bulge-like structures, as well as through scattering into thick-disc orbits and halo orbits (e.g. MW; Bournaud et al. 2011; Sales et al. 2012; Wilman et al. 2013; Schulze et al. 2020; Barsanti et al. 2022). With the advent of integral-field spectroscopy (IFS; e.g. SAURON, Bacon et al. 2001, MUSE, Bacon et al. 2010, and SAMI, Croom et al. 2012), it is now feasible to examine the spatially resolved stellar kinematic maps of massive disc galaxies and link them to other physical properties and merger history.
Photometric studies have revealed the existence of many morphological substructures in galaxies. The largest diversity (and greatest potential for photometric superposition) is found in the central regions of discs as a result of bars, nuclear discs, and boxy-peanut (BP) bulges (e.g. Sheth et al. 2005; Coelho & Gadotti 2011; Athanassoula et al. 2015; Neumann et al. 2017; Seo et al. 2019; Donohoe-Keyes et al. 2019). Stellar bars can form either in the centre of spiral galaxies in isolation (e.g. Hohl 1971; Ostriker & Peebles 1973) or be induced through tidal forces arising from galaxy-galaxy interactions and mergers (e.g. Noguchi 1987; Salo 1991). Bars can further funnel gas to the centre of galaxies, forming nuclear discs (e.g. Binney et al. 1991; Athanassoula 1992; Piner et al. 1995; Falcón-Barroso et al. 2006; Wozniak 2015; Du et al. 2015; Méndez-Abreu et al. 2019; Gadotti et al. 2020; Bittner et al. 2020; Verwilghen et al. 2024) and evolve to buckle vertically out of the disc plane (e.g. Combes & Sanders 1981; Bureau & Freeman 1999; Erwin & Debattista 2017; Kruk et al. 2019), giving rise to BP bulges. Evidently, the study of bulges, bars, nuclear discs, and BP bulges can assist in tracing the evolutionary history of a galaxy. However, while each component manifests itself photometrically, the integrated 2D projection of light we observe on the sky represents all of them together, leading to a highly degenerate problem. Although some work has been carried out using major axis surface brightness profiles to identify bars at certain position angles (e.g. Freeman 1970; Lütticke et al. 2000a,b; Bureau et al. 2006), one key way to disentangling these components lies in the stellar kinematics, where a line-of-sight velocity distribution (LOSVD) can be determined for each spaxel of a galaxy.
Building on previous work (e.g. Athanassoula 1992; Bureau & Athanassoula 2005; Iannuzzi & Athanassoula 2015; Li et al. 2018), Fraser-McKelvie et al. (2025) employed a Gauss-Hermite parametrisation of stellar kinematics (V, σ, h3, and h4) (van der Marel & Franx 1993; Gerhard 1993) to qualitatively classify central kinematic structure (e.g. bars and nuclear discs) in 12 edge-on disc galaxies from the GECKOS1 (van de Sande et al. 2024) sample. However, the physical interpretation of stellar kinematics can be challenging. While Gauss-Hermite parameters quantify the shape of the LOSVD and are sensitive to underlying kinematic structures (e.g. Chung & Bureau 2004; Bureau & Athanassoula 2005; Fragkoudi et al. 2020), these quantities are shaped by a combination of intrinsic galaxy properties, such as mass distribution and velocity anisotropy, as well as projection effects, such as inclination and line-of-sight (LoS) integration. This is where dynamical modelling becomes essential, as it can turn observed velocity maps into physically interpretable quantities.
In particular, axisymmetric Jeans anisotropic models (JAMs, Cappellari 2008, 2020) have been widely applied to early-type and passive disc galaxies (e.g. Cappellari et al. 2013; Li et al. 2017; Ene et al. 2019), which are typically well suited to axisymmetric modelling due to their lack of strong internal kinematic structure (e.g. bars) and low levels of dust obscuration. To separate the velocities of JAM models into ordered and random motions, it is necessary to make assumptions about velocity anisotropy. However, enclosed mass profiles and stellar mass-to-light ratios can be recovered from just the Vrms field, and JAM models can still reliably recover these for galaxies with modest velocity non-axisymmetries (e.g. Lablanche et al. 2012; Li et al. 2016).
A complete picture of galaxy evolution requires kinematic models not only of passive galaxies, but also of a full sample across all star formation rates. In particular, the GECKOS (van de Sande et al. 2024, van de Sande et al. in prep.) sample provides a particularly difficult opportunity, as they were selected with a > 2 dex range in star formation rates. In this context, JAM typically struggles with strongly star-forming galaxies, particularly those with complex kinematic structures (e.g. Mitzkus et al. 2017). Dust further complicates modelling, particularly in the edge-on case, where it attenuates light from the far side of the disc, preferentially obscures dynamically cold components, and effectively alters the stellar populations probed. Moreover, the stellar orbits of bars and multiple kinematically decoupled discs (e.g. nuclear discs) are complex and non-axisymmetric (e.g. Skokos et al. 2002a,b; Binney & Tremaine 2008; Valluri et al. 2016; Tikhonenko et al. 2021). The x1 orbits in stellar bars (Contopoulos & Papayannopoulos 1980), for example, generate excess non-axisymmetric LoS velocities at the bar ends (e.g. Athanassoula 1992; Sellwood & Wilkinson 1993; Fragkoudi et al. 2017; Kim et al. 2024) that are fundamentally inconsistent with an axisymmetric model. Despite these challenges, modelling GECKOS galaxies comprehensively across a range of star formation rates and dust obscuration levels provides an opportunity to understand how dust affects derived dynamical parameters for edge-on discs, and further enables us to probe how the combination of structures, such as bars and dynamically cold discs, affects kinematic measurements.
Orbit-superposition techniques such as Schwarzschild modelling (Schwarzschild 1979; Jethwa et al. 2020) offer a more general approach, capable of handling orbits arising from within a non-axisymmetric potential (e.g. Krajnović et al. 2005; van den Bosch et al. 2008; Vasiliev 2013; Krajnović et al. 2015; Vasiliev & Valluri 2020; Jethwa et al. 2020; Tahmasebzadeh et al. 2022), and have recently shown success in reproducing barred and multi-component structures (Tahmasebzadeh et al. 2024). Other techniques such as asymmetric drift correction (Leung et al. 2018) have also been applied; however, these techniques are very computationally demanding and suffer from the same dust obscuration issues as JAM.
To improve our understanding of how dust and kinematic structure affect dynamical modelling of edge-on galaxies, we have two goals in this paper: the first, to examine and quantify the effect of dust on the goodness-of-fit criterion and returned dynamical parameters of JAM models applied to edge-on discs; and the second, to explore the diversity of kinematic structures at the centre of GECKOS galaxies. To this end, we propose a simple experiment to understand what would happen if we attempt to model an edge-on galaxy with only simple, axisymmetric disc components. The outer regions of unflared disc galaxies are well modelled (i.e. stellar mass and circular velocity can be well recovered) in most cases with a dynamically cold ‘thin’ disc, with or without the addition of a dynamically warmer ‘thick’ disc (Kalinova et al. 2017; Leung et al. 2018). We wish to understand how the velocity residuals obtained after subtracting a JAM model from the data are affected by dust, and if we can link any coherent residual structure to non-axisymmetric kinematic components present. Edge-on galaxies are the perfect test bed for such an experiment, as the greatest component of LoS velocity is available to us, dust effects are maximised, and central structure light (i.e. structures that ‘bulge’ out of the disc) is not superimposed with disc light.
In this paper, we construct axisymmetric JAM models of seven galaxies from the GECKOS survey, representative of a range of star formation rates (SFRs), dust levels, and kinematic structures. In Sect. 2 we describe the GECKOS data, our sample selection, and surface brightness modelling. In Sect. 3 we briefly describe the JAM method and how we applied it to our work. In Sect. 4 we describe how different dust masks affect the goodness of fit of our models and describe coherent structures visible in the velocity residuals of our least dusty galaxy, NGC 3957. In Sect. 5 we quantify the impact of dust on the dynamical parameters derived from JAM models and extend the analysis of kinematic structures to the remaining galaxies in our sample. Throughout this paper, we use ΛCDM cosmology, with Ωm = 0.30, ΩΛ = 0.70, and H0 = 70 km s−1 Mpc−1, and a Chabrier (2003) stellar initial mass function.
2. Data
The GECKOS survey is a European Organisation for Astronomical Research in the Southern Hemisphere (ESO) Very Large Telescope (VLT)/Multi-Unit Spectroscopic Explorer (MUSE) large programme. The GECKOS survey targets 36 edge-on disc galaxies, aiming for a S/N of 40 Å−1 per Voronoi bin (Cappellari & Copin 2003), extending to a surface brightness isophote of μg = 23.5 mag arcsec−2–comparable to the Sun’s location in the Galactic disc (Melchior et al. 2007). Targets were selected within a heliocentric distance range of 15 to 70 Mpc from the S4G survey (25/36; Sheth et al. 2010) and HyperLeda (11/36; Makarov et al. 2014). Eight galaxies in the sample possess archival data, and we build on these to reach the required surface brightness constraints.
2.1. Sample selection
We selected galaxies for this study based on two criteria: (i) they were observed and reduced prior to December 2023, and (ii) archival Spitzer IRAC 3.6 μm photometry is available for use in Multi-Gaussian Expansion (MGE) modelling (see Sect. 2.3.2). We attempted to avoid dust attenuation in our mass and luminosity models by deriving them from Spitzer IRAC 3.6 μm imaging. These constraints resulted in a pilot sample of seven galaxies: NGC 5775, UGC 00903, NGC 3279, NGC 0360, IC 1711, NGC 0522, and NGC 3957. NGC 5775 and UGC 00903 exhibit star formation rates exceeding that of the Milky Way, NGC 3279 and NGC 0360 have rates comparable to the Milky Way, while IC 1711, NGC 0522, and NGC 3957 show lower star formation activity. The Spitzer IRAC 3.6 μm imaging is presented in Fig. 1. Although this sample is limited in size, it covers a range of star formation rates, dust content, and kinematic structures. The properties of this sample are summarised in Table 1 and provide a useful test bed for exploring the impact of dust and non-axisymmetric structures on dynamical modelling. We note here that the MUSE spatial coverage varies from galaxy to galaxy, impacting the distribution of E(B − V) values observed in each system.
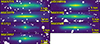 |
Fig. 1. Spitzer IRAC 3.6 μm imaging of our sample of seven GECKOS galaxies. The images are scaled with an inverse hyperbolic sine (arcsinh) scaling, and masked regions (bright stars, imaging artefacts) are shown in white. There are clear star-forming spiral arms in NGC 5775 and NGC 0360. |
Sample properties.
2.2. Data reduction and analysis
Data reduction was performed using the PYTHON package PYMUSEPIPE2 (Emsellem et al. 2022) and is described in Fraser-McKelvie et al. (2025). PYMUSEPIPE was used to create mosaicked data cubes from MUSE science exposures. PYMUSEPIPE was built around the MUSE Data Reduction Pipeline (Weilbacher et al. 2020) and behaves as a data organiser and wrapper for the ESO Recipe Execution Tool (ESOREX, ESO Cpl Development Team 2015).
To extract stellar kinematics from our data, we applied the nGIST3 pipeline (Fraser-McKelvie et al. 2025) on the fully reduced and mosaicked data cubes. nGIST is an upgraded version of the GIST pipeline (Bittner et al. 2019), which is a wrapper for existing spectral fitting routines for the analysis of IFS galaxy data. nGIST is a publicly available, modular, and documented4 code applicable to any galaxy IFS data.
In this study, we utilised nGIST version 7.2.1 to generate 2D maps of two-moment stellar kinematics, applying Voronoi binning to achieve an S/N of 100 per pixel (equivalent to 80 Å−1, calculated over the wavelength range of 4800–7000 Å). This wavelength range was chosen to minimise the inclusion of skylines in the S/N estimate. We chose a binning with S/N = 100 because we focus on the central regions of our galaxies, where S/N is very high and spaxels typically exceed this requirement. The kinematics were derived from a wavelength range of 4800–8700 Å. The Jeans equations, as implemented in JAM, are a function of the true moments V and σ. As a result, we approximate these true moments by enforcing a Gaussian LOSVD (fixing all high-order Gauss-Hermite coefficients to zero).
We utilised the penalised pixel fitting (pPXF) routine, as described by Cappellari & Emsellem (2004) and Cappellari (2017) in the nGIST stellar kinematics (KIN) module, in combination with the X-shooter stellar template library (Verro et al. 2022). We chose to use the X-shooter stellar library for its broad wavelength coverage, high spectral resolution near the Calcium II triplet (CaT), and agreement with prior studies suggesting that stellar spectra are generally more reliable than simple stellar populations (SSPs) for determining stellar kinematics (e.g. van de Sande et al. 2017; Belfiore et al. 2019). Following previous IFS studies including SAURON (Emsellem et al. 2004), ATLAS3D (Cappellari et al. 2011a), SAMI (van de Sande et al. 2017), MaNGA (Belfiore et al. 2019; Westfall et al. 2019), and PHANGS (Emsellem et al. 2022), a Legendre polynomial was applied to better match the data to the spectral templates. Motivated by the analysis of van de Sande et al. (2017) and its application to the GECKOS dataset in Fraser-McKelvie et al. (2025), we chose a 23rd-order additive Legendre polynomial. A first-order multiplicative polynomial is also fitted to correct minor continuum variations caused by imperfect sky subtraction and dust attenuation. Initial velocity guesses are sourced from the NASA Extragalactic Database, with a starting stellar velocity dispersion guess of 100 km s−1. In this work, we used the nGIST output mean LoS stellar velocity (V) and stellar velocity dispersion (σ) maps, along with the corresponding Voronoi bin positions. From the nGIST stellar populations and star formation histories module (SFH), we used the stellar dust absorption E(B − V) maps for our dust masking, calculated assuming a Calzetti et al. (2000) extinction curve. Additionally, we note that pPXF has been shown to underestimate formal uncertainties (e.g.Bergamini et al. 2019; Granata et al. 2025), with Bergamini et al. (2019) demonstrating that the true uncertainty in stellar velocity dispersion is 20% higher than the value derived by pPXF. As a result, we increased our σ uncertainty by 20% and conservatively increased our V uncertainty by 20% as well. As a final step, we calculated the median velocity from the V map within a circular aperture of diameter 1 kpc, centred on the galaxy, and subtracted this systemic velocity from the velocity map.
2.3. Surface brightness modelling
Dynamical modelling with the JAM formalism requires a model for the gravitational potential (which can also include, for example, a dark matter halo) and the tracer stellar population. We thus required both a) imaging of our galaxy sample that accurately represents the stellar distribution (i.e. unaffected by dust) and b) a method for modelling this stellar distribution that is efficient and allows computationally efficient evaluation of the Jeans equations.
2.3.1. Spitzer 3.6 μm imaging
As our sample contains highly inclined galaxies, the impact of dust absorption along the dust lane and/or photometric major axis is strong and requires care with the selection of our photometry. Any imaging in a wavelength band similar to the kinematic maps wavelength range (e.g. SDSS r band) is strongly affected by dust. For this reason, we chose to use 3.6 μm mid-IR imaging from the Spitzer Space Telescope (Fazio et al. 2004). Cutouts of each galaxy in our sample were downloaded from the NASA IPAC Infrared Science Archive and are shown in Fig. 1.
2.3.2. Multi-Gaussian expansion profiles
The majority of previous work with JAM has utilised the MGE parametrisation of Monnet et al. (1992), Emsellem et al. (1994a), which can accurately reproduce the surface brightness of real galaxies and has an efficient and widely used routine (Cappellari 2002). This approach assumes that the 2D projected luminosity, I, of a galaxy on the sky can be represented by a sum of N Gaussians. Each Gaussian has total luminosity Lk, an observed axial ratio q′k, and a dispersion σk along the major axis. This model may then be convolved with a second sum of Gaussians representing the point-spread function (PSF), which allows the model to stay within the MGE formalism.
We created MGE models of the Spitzer 3.6 μm imaging for each galaxy in our sample. We used a Gaussian with a full width at half maximum (FWHM) of 1.66″ (the average PSF for IRAC 3.6 μm imaging; Khan 2017) for our PSF. We fixed the position angle of all Gaussians to be the same, as JAM cannot account for non-axisymmetric structures. We show an example of an MGE fit to IC 1711 in Fig. 2. Similar fits were created for all galaxies in the sample. These resulting Spitzer MGEs were used as the model for the tracer stellar population, and its contribution to the total gravitational potential.
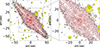 |
Fig. 2. MGE fit to the galaxy IC 1711. Spitzer 3.6 μm imaging contours are in black, the MGE model contours are in red, and masked regions (other sources) are in yellow. The contours are spaced by 0.5 mag arcsec−2. The right-side panel is a zoomed-in version of the left-side panel, with the scale shown by a box around the central region in the left-side panel. |
3. Methods
We used the solutions to the Jeans equations (Jeans 1922) in cylindrical coordinates, using the JAM code of Cappellari (2008). For a more detailed explanation of the formalism, see Cappellari (2008).
In this work, we assumed that the velocity ellipsoid is aligned with cylindrical coordinates, which has been shown to be accurate near the equatorial plane and along the minor axis of fast rotators (Cappellari et al. 2007). We used our MGE model as the luminous density for JAM. We then multiplied by a global and constant mass-to-light ratio and added a spherical Navarro–Frenk–White (NFW) (Navarro et al. 1997) dark matter profile to obtain our gravitational potential. The NFW profile is defined by only one parameter – the dark matter fraction within 1Re. The NFW slope was set to γ = −1, as in Navarro et al. (1997), and the halo break radius to r = 20 kpc. We made this choice as the halo break radius is not well constrained by typical spectroscopic datasets, which are heavily biased towards the central baryon-dominated regions (of MW-mass galaxies), and setting r = 20 kpc provides models of equally good quality as letting it vary (Bellstedt et al. 2018). Given that our GECKOS MUSE data do not extend beyond r = 20 kpc, the precise choice of break radius should not significantly affect dynamical parameters, nor the velocity residuals at even smaller radii.
We constructed JAM models for the seven galaxies in our sample. We used the EMCEE package (Foreman-Mackey et al. 2013) in PYTHON to fit the free parameters of the model for each galaxy, where the likelihood function is simply the JAM procedure of Cappellari (2008) and its derived global Vrmsχreduced2. We used a uniform prior across a reasonable estimation range for each free parameter. These free parameters are stellar mass-to-light ratio, dark matter fraction, inclination, and βj, the stellar orbital anisotropy of the individual Gaussians that compose the stellar MGE. The JAM model then outputs a Vrms map, where Vrms2 = V2 + σ2, V is the mean stellar velocity and σ is the stellar velocity dispersion. For each model, we applied a dust mask to the observed kinematic maps based on the E(B − V) stellar dust absorption maps, masking any Voronoi bin with E(B − V) above a given threshold. Our initial models adopt a cut-off value of E(B − V) = 0.7, but we also used several thresholds down to E(B − V) = 0.2 to test the robustness of our results against the impact of dust. Figure 3 illustrates the difference between our highest and lowest masking thresholds, with E(B − V) > 0.7 masked in the left column and E(B − V) > 0.2 masked in the right column. Finally, the first velocity moment, V, was found by defining a κ parameter for our luminous Gaussians. The κ parameter defines the amount of rotation in Vrms. Derived dynamical parameters were not affected by our choice of κ, as they are only dependent on the Vrms2 map. In principle, allowing κ to vary across the luminous Gaussians could improve the recovery of the V map, as different components such as thin discs, thick discs, and nuclear discs have different rotational supports. However, to maintain simplicity, we adopted a single constant κ, scaled so that the model velocity field matched the projected angular momentum of our observed galaxy.
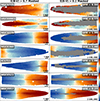 |
Fig. 3. Illustration of masking for two E(B − V) thresholds across our sample, overlaid on the V maps. Each row corresponds to a galaxy, ordered from top to bottom by decreasing star formation rate. The left column shows masks where Voronoi bins with E(B − V) > 0.7 are excluded (greyed out), while the right column shows masks for E(B − V) > 0.2. Galaxies are also labelled with their star formation rates in M⊙ yr−1. We show the range in the velocity colour bar in the bottom right of the right-side panels. Aggressive masking removes most mid-plane bins in highly star-forming galaxies. |
4. Results
4.1. JAM models
We fitted the JAM models to each galaxy in our sample, applying our E(B − V) < 0.7 requirement to each Voronoi bin in this first set of models. Maps of Vrms and the derived quantities V and σ, are shown in Figs. 4–6 for NGC 3957, IC 1711, and NGC 0522. The remaining galaxies do not exhibit clear non-axisymmetric structure, and their maps are shown in Figs. A.1–A.4. The left column shows Vrms, V, and σ derived from nGIST output for the seven GECKOS galaxies, the central column shows the same but from the JAM model, and the right column shows the residuals, i.e. data minus model.
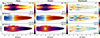 |
Fig. 4. JAM model for galaxy NGC 3957. The upper row shows the Vrms map, the central row shows the V map, and the lower row shows the σ map. The left column shows nGIST mean light-weighted velocity V and σ binned to S/N = 100, as well as the derived quantity |

Measuring the goodness of fit of our models was not straightforward, particularly given that non-axisymmetric structures are expected to induce systematic discrepancies between the observed and modelled kinematics, particularly in the bulge-dominated regions of our galaxies. One of our aims was to use these discrepancies, where possible, to diagnose these structures. As a result, instead of evaluating χreduced2 as a global statistic, we evaluated it as a function of radius. We computed χreduced2 as a moving average, within radial bins of 0.5 × Rd, where Rd is the disc scale radius (Salo et al. 2015)5. This radial smoothing allowed us to identify how well the different regions of our galaxy (e.g. bulge dominated and disc dominated) were fit.
Figure 7 illustrates the goodness of fit for each galaxy in our sample as a function of radius and dust masking level. In each panel, we show the moving average of χreduced2, for each mask threshold in E(B − V). The x-axis is shown as a function of disc scale radius, and the y-axis range is kept the same for each galaxy to aid in comparison. We show χreduced2 = 1 as a dotted line, and Rd = 0.5 (the bulge-dominated region, e.g. Fisher & Drory 2010) and Rd = 2.2 (the disc-dominated region, e.g. Freeman 1970; Persic et al. 1996) as vertical dashed lines. Finally, we plot the χreduced2 measure for our E(B − V) ≤ 0.7 model, but only applied to E(B − V) ≤ 0.2 bins in grey. We first find that in the disc-dominated region (0.5 < R/Rd < 2.2), most galaxies approach χreduced2 ⪅ 5, indicating a reasonable fit for the disc component of the galaxy, in comparison to the bulge. In our most actively star-forming galaxies (NGC 5775, UGC 00903, and NGC 3279), more aggressive dust masking results in strong improvement. This is less apparent but remains true within the bulge-dominated region (R/Rd < 0.5) of NGC 0360 and NGC 0522. However, IC 1711 and NGC 3957 show little improvement with stronger masking. Interestingly, these galaxies have previously been identified as hosting non-axisymmetric structures (bars, Fraser-McKelvie et al. 2025). This may hence indicate that these non-improving galaxies possess non-axisymmetric structures. However, as these galaxies also have the lowest SFRs and thus presumably lower dust content, the smaller improvement from dust masking might reflect fewer bins being masked. The χreduced2 measure for our E(B − V) ≤ 0.7 model applied to E(B − V) ≤ 0.2 bins generally follows the E(B − V) ≤ 0.2 model for most galaxies, with the exception of NGC 5775. This is because for most galaxies, there are not enough dusty bins with 0.2 < E(B − V) < 0.7 to affect the fit significantly, and χreduced2 is driven almost entirely by only measuring dust-free bins. In the case of NGC 5775, there are enough dusty bins to affect the E(B − V) ≤ 0.7 model. Overall, in the disc-dominated region (0.5 < R/Rd < 2.2), we find that most galaxies approach χreduced2 ⪅ 5, indicating a reasonable fit for the disc component of the galaxy in comparison to the bulge.
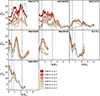 |
Fig. 7. Moving-average χreduced2 value for each galaxy in our sample, plotted as a function of R/Rd, where Rd is the disc scale length. For each galaxy and each dust masking cut-off, we measure χreduced2 in a 0.5 × Rd bin, spaced in radius along the major axis. χreduced2 = 1 is represented by a dotted line, and Rd = 0.5 (bulge-dominated region, e.g. Fisher & Drory 2010) and Rd = 2.2 (disc-dominated region, (e.g. Freeman 1970; Persic et al. 1996)) are represented by vertical dashed lines. We also plot in grey the χreduced2 measure for our E(B − V) ≤ 0.7 model, but applied to E(B − V) ≤ 0.2 bins. Dotted blue lines are plotted at 3.5 kpc for IC 1711 and at 2.5 kpc for NGC 3957, the radius at which their photometric shoulders end (see Sect. 5.2.1). We note that NGC 5775 and NGC 0360 are not perfectly edge-on and show clear spiral arms in their photometry. This explains their strong peaks in χreduced2. A general trend of decreasing χreduced2 with mask level is shown, as well as discs fit better than bulges. |
4.2. Kinematic residual map structure
We now examine the spatial distribution of kinematic residuals. These residual maps contain valuable information about localised deviations from axisymmetry. Nonetheless, we must be careful to take into consideration the effect of dust and masking. We note here that JAM fits a symmetrised transformation of the input kinematics. Thus, some velocity residual structures are introduced purely by this symmetrisation process and should not be misinterpreted as non-axisymmetric velocity components. To illustrate this we show the V maps for our sample as well as the symmetrised Vsym maps in Fig. 8. We also compare the residuals V − Vsym, V − Vmodel, and Vsym − Vmodel. The Vsym − Vmodel residual should be free of any structures due to symmetrisation, and thus we only classify structures that are clearly visible in this and the V − Vmodel residual.
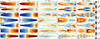 |
Fig. 8. Velocity maps for all seven galaxies in our sample, demonstrating the effect of symmetrisation within the JAM model. The leftmost column shows the observed velocity (V) maps. The Vsym column presents the same velocity maps after applying the symmetrisation procedure used by the JAM model. The V − Vsym column shows the residuals between the observed and symmetrised velocities. The V − Vmodel column shows the residuals between the observed velocity and the best-fitting JAM model (with a mask of E(B − V) < 0.7). Finally, The Vsym − Vmodel column shows the residuals between the symmetrised velocity field and the JAM model. Our diagnosis of non-axisymmetric velocity structures consider only features that are also clearly visible in the Vsym − Vmodel residuals, as these are unaffected by the symmetrisation process. |
We begin our analysis with NGC 3957, which has the lowest SFR, the lowest median E(B − V), and the best-fit model that exhibits only small variations with changes in our masking threshold. We thus expect the JAM models of NGC 3957 to have the least impact from dust obscuration, with any deviations from a good model fit due to non-axisymmetric structure rather than dust. However, we take care to consider only structures in the kinematic residuals that are not impacted by dust (i.e. visible even with E(B − V) < 0.2 masking applied; see Fig. 3). Finally, we obtain the kinematic structure classification from Fraser-McKelvie et al. (2025), which suggests that NGC 3957 has a BP bulge and nuclear disc. In Fig. 4 we highlight coherent structures in the V residual maps of NGC 3957 by circling these structures in dashed ellipses.
A compact, symmetric (around R = 0) feature of residual velocity exceeding that of its surroundings is apparent in the V residual map (R ⪅ 1 kpc), suggestive of a nuclear disc. This residual feature peaks at approximately 0.25kpc along the major axis in agreement with the size of the nuclear disc in NGC 3957 found by Fraser-McKelvie et al. (2025, 0.28kpc). Although nuclear discs are, to a good approximation, axisymmetric (although some host nuclear bars) and could, in principle, be modelled with JAM, accurate recovery would require finely tuned low-dispersion, highly flattened Gaussians in the MGE. We acknowledge a larger structure below the mid-plane, with inverted signs at a similar scale, which we have not circled. However, as seen in Fig. 8, this is an artefact of the velocity symmetrisation process of the JAM model. Thus, we do not consider it correlated with any physical structure.
At intermediate radii (∼2.5 kpc), we identify and circle prominent residuals in the V residual map along the major axis that stand out in magnitude and structure, exhibiting opposite signs across the disc and exceeding the surrounding residual levels. These structures suggest an excess of mean velocity, a few kiloparsecs along the major axis of the disc, on both sides of the galaxy centre. This is consistent with the kinematic signatures expected from a bar, where non-circular motions generate excess LoS velocities near the bar ends (e.g. Athanassoula 1992; Sellwood & Wilkinson 1993; Fragkoudi et al. 2017; Kim et al. 2024).
Finally, the V residual maps reveal an X-shaped structure. Such features are known indicators of BP bulges when observed photometrically via unsharp masking (e.g. Bureau et al. 2006; Fraser-McKelvie et al. 2025), tracing stars on vertically resonant orbits. The detection of an X-shaped residual in the stellar kinematic V map supports the interpretation of a BP bulge, as velocity moments can trace this structure off the plane of the disc (Iannuzzi & Athanassoula 2015; Fragkoudi et al. 2017) due to the bifurcated x1 orbits that populate BP bulges (e.g. Skokos et al. 2002a; Patsis & Xilouris 2006).
We use NGC 3957 as an illustrative example, given its clear kinematic signatures and known structures. The remaining galaxies with notable residuals are IC 1711 and NGC 0522, and are discussed in Sect. 5.2.2. The remaining galaxies in our sample (NGC 0360, NGC 3279, NGC 5775, and UGC 00903) do not show residuals consistent with known structures, and hence we do not discuss their residuals in detail.
5. Discussion
5.1. The impact of dust on JAM models of edge-on disc galaxies
Most previous applications of JAM modelling have been applied to passive, dust-free, and unbarred galaxies, where the model assumption of axisymmetry is likely to hold. Early work with the JAM formalism (e.g. Monnet et al. 1992; Emsellem et al. 1994a,b, 1999; Cappellari 2008; Cappellari et al. 2009, 2013) was primarily performed on early-type galaxies from the SAURON and ATLAS3D surveys. These studies demonstrated that JAM models could robustly recover the mass-to-light ratio (M/L), velocity anisotropy, and dark matter fraction for elliptical and lenticular galaxies. There has been work done on barred systems (e.g. Lablanche et al. 2012; Li et al. 2016), but these have mostly been simulation studies.
In contrast, dusty, star-forming disc galaxies pose significant challenges to dynamical modelling. These systems are affected by prominent dust lanes that distort both the observed light distribution and the weighting of the stellar kinematics. As a result, they violate JAM assumptions and are generally under-represented in the JAM literature. While some work has been carried out on JAM’s reliability in more complex systems (e.g. Lablanche et al. 2012; Li et al. 2016), observational applications to highly spatially resolved, dusty, star-forming discs remain rare. Some work has been done on samples that contain spiral galaxies (e.g. Scott et al. 2015; Zhu et al. 2023), but a thorough discussion of the impact of dust was not included. This study therefore represents one of the first applications of JAM to such galaxies with the intention of studying the effects of dust. By focusing on a small but representative sample of edge-on discs with a range of dust distributions and star formation rates, we explore whether JAM can still provide reliable dynamical constraints under these more difficult conditions.
To test whether reliable dynamical parameters could be extracted from partially masked data, we compared derived enclosed masses at 2.5kpc, 4.0kpc, and 10.0kpc, as well as derived inclinations, across a range of dust masks from E(B − V) > 0.2 to E(B − V) > 1.0. The enclosed mass values are a function of the derived M/L and dark matter fraction, as the MGE light model for each galaxy remains consistent. All galaxies show stable values within 10%, indicating that global dynamical properties remain robust even when excluding the kinematics of the dust-dominated central regions. Interestingly, UGC 00903 has both a comparable Vrms fit and reliably determined dynamical parameters relative to the rest of the sample, despite hosting the most unusual kinematic structure, with a clearly visible counter-rotating thick disc (see Fig. A.4). This is because dynamical parameters are recovered solely from the Vrms field, which is independent of how the kinematics separate into ordered and random motions, does not depend on the sign of V, and makes no assumptions about the anisotropy. Indeed, JAM has been used previously to find the mass distribution of galaxies with counter-rotating discs (Mitzkus et al. 2017).
Our results are consistent with previous simulation-based studies, demonstrating that global M/L ratios in edge-on discs can be reliably recovered with JAM modelling, even in the presence of non-axisymmetric structures (Lablanche et al. 2012), and that the enclosed mass can be recovered to within 10% when the true mass distribution is known (Li et al. 2016). We extend these findings by showing that, although the true enclosed mass is unknown for our galaxies, the recovered mass remains consistent within 10% and is not biased across a wide range of dust masking thresholds.
5.2. Connecting residuals to physical structure
5.2.1. NGC 3957 as a benchmark system
NGC 3957 provides a particularly clean case for interpreting residuals, due to its combination of low dust content, low star formation rate, and clear photometric features suggestive of non-axisymmetry. Most importantly, we are more confident that these features are due to non-axisymmetries, because the dust content is low (Fig. 3), our model changes little when we apply more aggressive masking (Fig. 7), and the features are not apparent in the symmetrised velocity residuals (Fig. 8). As our best-fitting system, it provides an ideal benchmark for interpreting residuals in terms of physical substructures.
Photometric evidence supports the presence of a bar in NGC 3957. As discussed by Bureau & Athanassoula (2005), Freeman Type II surface brightness profiles (Freeman 1970) are suggestive evidence of bar structure (e.g. Gadotti & de Souza 2003; Erwin et al. 2008; Kim et al. 2016), due to resonances and instabilities in the bar leading to a redistribution of disc material. A Freeman Type II profile occurs when the major-axis surface brightness exhibits a local depression beyond the central component, followed by a flat or slightly rising plateau (depending on the bar orientation) before transitioning into an outer exponential decline. Of the seven GECKOS galaxies in our sample, only NGC 3957 and IC 1711 clearly display this shoulder in their major-axis 3.6 μm surface brightness profiles, which we show in Fig. 9. We also note that NGC 0522 shows possible kinematic evidence for a bar (see Sect. 5.2.2), and its surface brightness profile shows noticeable flattening but less pronounced shoulders than NGC 3957 and IC 1711. We caution that this signature is only visible when the bar is not oriented end-on, as projection effects can obscure the shoulder (e.g. Lütticke et al. 2000b; Athanassoula 2005).
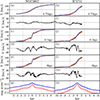 |
Fig. 9. Stellar velocities and surface brightness profiles for NGC 3957 and IC 1711. For NGC 3957, panels (a), (c), and (e) show velocities extracted from horizontal slits parallel to the major axis, with the data in orange and the model in purple. Panel (a) shows a slit offset from the major axis by 0.75 kpc, panel (c) by 0.1 kpc, and panel (e) by 0 kpc. Panels (b), (d), and (f) show the residual velocity from the slits in the panels above, (a), (c), and (e) respectively. Panel (g) shows the surface brightness profiles from Spitzer IRAC 3.6 μm imaging. The total flux summed along the minor axis for each point along the major axis is shown in blue, and the flux along the major axis is shown in red. The dashed black vertical lines at ±2.5 kpc indicate where the photometric shoulders in the major axis profile end. The same is shown for IC 1711 with panels (h), (j), and (l) indicating corresponding velocities; (i), (k), and (m) indicating residuals; and panel (n) indicating surface brightness profiles. Dashed black vertical lines shown at 3.5 kpc indicate where the photometric shoulders end. |
In Sect. 4.2, we highlighted the different structures visible in the V map residuals for NGC 3957. Here, we attempt to correlate these velocity residuals with photometric evidence for a bar. If a bar is present, we expect non-axisymmetric stellar motions, particularly those from elongated x1 orbits in the disc plane, to manifest as velocity excesses along the disc major axis. For this, we extract velocities from the data, model, and residual maps along three slices, each 1.5″ thick: one along the mid-plane (0 kpc offset), one just above it (0.1 kpc), and one further off-plane (0.75 kpc). All slices were taken on one side of the mid-plane, on the opposite side of the dust lane. This allows us to probe both in-plane structures and off-plane structures away from the dust lane.
In Fig. 9, we show the velocity profiles along these slits for NGC 3957 and IC 1711, with the data represented by the orange line, the model by the purple line, and the residual by the black line. We also show the photometric shoulders from Spitzer IRAC 3.6 μm imaging. The vertical dashed lines are drawn to approximately where the photometric shoulders end. For NGC 3957, this corresponds to a radius of ∼2.5 kpc, almost exactly where the peak is in the residual velocities, seen most strongly in the 0.1 kpc offset slit.
We include IC 1711 in the same figure for comparison. Although this galaxy has more dust, it also exhibits a Freeman Type II profile and strong velocity residuals. The photometric shoulders for IC 1711 are at a radius of ∼3.5 kpc, corresponding almost exactly to where the excess velocities drop to zero after a peak, seen most strongly in the 0 kpc and 0.1 kpc offset slits. While this is different from NGC 3957, where the shoulders spatially corresponded to a peak in velocity residuals, the resemblance to NGC 3957 still lends further support to the interpretation that such kinematic structures can trace bar-like components, even in dustier systems. Further to this, we see strong peaks in χreduced2 at 2.5 kpc for NGC 3957 and 3.5 kpc for IC 1711 in Fig. 7. As modelled Vrms requires fewer assumptions than modelled V, this lends greater weight to the correlation between these kinematic residuals and the presence of a bar. We emphasise here that we are simply showing that there is a spatial correlation between the kinematic residuals and photometric major-axis shoulders in both NGC 3957 and IC 1711. We do not make predictions on what orbital structures cause this, nor any implied bar size or position angle.
5.2.2. Extending lessons from NGC 3957 to our remaining sample
Building on the lessons from NGC 3957, we explore whether similar interpretations of residuals can be extended to dustier, more star-forming galaxies in our sample. We note here that NGC 3957 has been identified as hosting a BP bulge in previous studies (Bureau & Freeman 1999; Lütticke et al. 2000b; Fraser-McKelvie et al. 2025), as well as IC 1711 (Buta et al. 2015; Fraser-McKelvie et al. 2025) and NGC 0522 (Lütticke et al. 2000b; Buta et al. 2015; Fraser-McKelvie et al. 2025). While increased dust complicates the analysis, we suggest several possible structures due to non-axisymmetric orbits in the residual maps of galaxies IC 1711 and NGC 0522.
IC 1711 (Fig. 5) was shown to share several key properties with NGC 3957 in Sect. 5.2.1: both exhibit clear Freeman Type II surface brightness profiles (Fig. 9) and coherent residual structures in their velocity maps. Here, we note that the major axis residuals in IC 1711 are indeed still somewhat visible even with our most aggressive mask (E(B − V) > 0.2). This supports the interpretation that, despite IC 1711’s higher dust content (median E(B − V) of 0.107, c.f. 0.048 for NGC 3957), its kinematic residuals are still spatially correlated with photometric evidence for a bar and could trace bar orbits.
NGC 0522 presents a more ambiguous case. Unlike NGC 3957 and IC 1711, it does not exhibit a clear Freeman Type II profile, though it does show noticeable flattening in its major-axis surface brightness distribution. The velocity residuals in NGC 0522 (Fig. 6) also lack the distinct major-axis excess seen in NGC 3957 and IC 1711. Nevertheless, the residuals in NGC 0522 show a notable X-shaped pattern in the off-plane regions of the residual map, qualitatively similar to the pattern we previously noted for NGC 3957 in Sect. 4.2. Importantly for this analysis, this pattern is still visible regardless of our dust mask. This structure is morphologically similar to the residuals produced by BP bulges: vertically thickened inner bar structures that arise from dynamical instabilities (Combes & Sanders 1981; Bureau & Athanassoula 2005). Indeed, Laurikainen et al. (2014) and Fraser-McKelvie et al. (2025) found that NGC 0522 shows this structure in unsharp-masked 3.6 μm imaging. Buckled BP bulges have been shown to induce complex non-circular motions, especially in edge-on projections. Iannuzzi & Athanassoula (2015) found that higher-order h3 and h4 maps trace BP off the plane of the disc, and Fragkoudi et al. (2017) found the same for mean velocities. While we cannot conclusively identify a bar in NGC 0522, the presence of this X-shaped kinematic signature, as well as the flattened major-axis surface brightness distribution, provides evidence for a BP bulge. Given that previous work has established the presence of a BP bulge in imaging, the lack of strong kinematic evidence for a bar implies a side-on bar orientation, which is the same conclusion reached by Fraser-McKelvie et al. (2025) for this galaxy.
5.2.3. General trends across the sample and practical guidelines
While we focus on a detailed residual interpretation for the three systems, Fig. 7 shows that all galaxies in our sample achieve acceptable JAM disc fits, with dust masking being important for our most star-forming galaxies (NGC 5775, UGC 00903, and NGC 3279), consistent with the expected correlation between dust content and SFR in star-forming discs (e.g. Calzetti 2001; Martis et al. 2019; Pappalardo et al. 2021; Tacchella et al. 2022). Despite this, derived enclosed mass remains consistent across mask levels, with variations below 10%, in line with earlier JAM analyses (Lablanche et al. 2012; Li et al. 2016).
Crucially, velocity residuals still reveal coherent kinematic signatures of non-axisymmetric structures in NGC 3957, IC 1711, and NGC 0522 even when an aggressive E(B − V) > 0.2 mask is applied and masked bins are not considered. These detections are supported, in the case of NGC 3957 and IC 1711, by photometric evidence for a bar. We suggest that residual-based identification of internal structure remains viable under substantial dust masking, provided the features persist.
We therefore acknowledge that applying a dust mask of at least E(B − V) > 0.7 is sufficient to recover reliable dynamical parameters in edge-on systems. However, given that these derived dynamical parameters are consistent across dust maskings and residual-based identification of non-axisymmetric structure is most reliable when a strong dust mask is applied, we recommend applying a dust mask of E(B − V) > 0.2 for general application of JAM models to edge-on disc galaxies.
6. Summary and conclusions
In this paper, we investigated the limitations of axisymmetric dynamical modelling of edge-on disc galaxies, focusing on the combined effects of dust attenuation and non-axisymmetric structure on stellar kinematic residuals. We constructed Jeans Anisotropic MGE (JAM) models for seven galaxies in the GECKOS VLT/MUSE survey, using 3.6 μm Spitzer IRAC photometry for the light and mass model, with an additional NFW dark matter profile included in the mass model.
One of the goals of this work was to assess what information about non-axisymmetric kinematic structures could be recovered from edge-on galaxies by subtracting a simple, axisymmetric dynamical model. By creating JAM models of a sample of GECKOS galaxies with varying dust content and structural complexity, we tested whether coherent features in the velocity residuals could reveal underlying non-axisymmetric structure. The velocity residuals between data and model in NGC 3957, our least dusty target, revealed coherent patterns aligned with expected bar orbits and photometry, suggesting a clear link between residual structure and underlying non-axisymmetric kinematics. We extended this analysis to dustier galaxies, which showed velocity residuals similar to NGC 3957. IC 1711 showed similar coherent patterns aligned with photometry, despite the impact of dust. NGC 0522 also had residuals strongly impacted by dust, but off-plane structures showed promise of a diagnostic of vertical bar instabilities. Our results therefore suggest that residual maps from JAM can be a powerful diagnostic for barred structure, provided that regions with dust extinctions of E(B − V) > 0.2 are masked.
We found that JAM fits discs well in all galaxies, and applying stricter E(B − V) masks (e.g. > 0.2 or > 0.4) resulted in χreduced2 ≤ 5 in the disc region. Additionally, all galaxies showed consistent (within 10%) values of enclosed mass and inclination across a range of dust masks. Notably, galaxies previously classified as containing central non-axisymmetric structure by Fraser-McKelvie et al. (2025) showed the smallest changes with increased masking. This is likely due to a combination of factors: these galaxies having low dust content and hence fewer masked bins in general, along with non-axisymmetric structures imposing an upper bound on how well-fit these galaxies can be.
Future studies incorporating radiative transfer modelling or higher-resolution multi-band imaging could help disentangle the effects of dust and stellar populations on observed kinematics in regions where the dust is optically thin. Extending this analysis to the full GECKOS sample of edge-on galaxies, with a range of structural properties and inclinations, will provide stronger statistical constraints on when and where JAM residuals can be reliably used to detect kinematic structure. For example, the three galaxies in our sample with previously identified bars (NGC 3957, IC 1711, and NGC 0522) are the three least dusty galaxies, so a sample of galaxies with higher dust content and kinematic structure would provide new insights into the upper limit on dust extinction where kinematic components can still be identified. Additionally, a comparison of our work to simulations will allow a more confident determination of whether residual structure truly corresponds to non-axisymmetric orbits. Finally, this work provides a starting point for the GECKOS dynamical modelling effort, and the lessons learned on dust masking and MGE fitting will inform future papers. Future GECKOS studies will employ more complex techniques such as orbit-superposition modelling to explicitly model stellar bars (Tahmasebzadeh et al. 2022, 2024) and derive parameters such as bar pattern speed. Alternative approaches are also possible, such as the method of Fridman et al. (2005), who derived bar pattern speeds from Hα residual velocity maps with appropriate dust masking.
We emphasise caution when applying axisymmetric models to edge-on galaxies. Dust along the line of sight affects the observed kinematics, especially in the mid-plane, tracing only a subset of stars. While using near-infrared imaging helps reduce this bias in the mass model, this imaging introduces a mismatch in our stellar tracer model when compared to optical kinematics, which appears, for example, in poor modelling of nuclear discs. However, the impact of this mismatch between tracer wavelengths could be improved in the future by allowing M/L to vary with each luminous Gaussian, for example. Despite these limitations, global parameters such as enclosed mass and inclination are robustly recovered, even under aggressive masking. A mask of E(B − V) > 0.7 is sufficient for stable global results, whereas the stricter mask of E(B − V) > 0.2 should be applied when using residual maps for diagnosing non-axisymmetric structures. This suggests that, independent of their kinematic complexity, dusty star-forming edge-on discs can be reliably modelled axisymmetrically at a global level, while residual maps can serve as a window into their more complex kinematic substructure, shedding light on the internal dynamics that trace their evolution.
Generalising edge-on galaxies and their chemical bimodalities, kinematics, and outflows out to Solar environments.
Disc scale-radii for Spitzer 3.6 μm imaging were derived for multi-component Sérsic fits. We estimated Rd for NGC 3957 from a second-component Sérsic fit to its photometry, as this was not calculated by Salo et al. (2015).
Acknowledgments
This work is based on observations obtained with ESO telescopes at the La Silla Paranal Observatory under programme ID 110.24AS. We gratefully acknowledge the support of the ESO staff, and in particular the dedicated team at Paranal Observatory, for their efforts in executing the GECKOS observations. This research was partially supported by the Australian Research Council Centre of Excellence for All Sky Astrophysics in 3 Dimensions (ASTRO 3D), through project number CE170100013. THR acknowledges the support and funding of an ESO Studentship. AFM acknowledges the support and funding of an ESO Fellowship. AP acknowledges support from the Hintze Family Charity Foundation. MM acknowledges support from the UK Science and Technology Facilities Council through grant ST/Y002490/1. DAG acknowledges support from the UK Science and Technology Facilities Council through grant ST/X001075/1. FP acknowledges support from the Horizon Europe research and innovation programme under the Maria Skłodowska-Curie grant “TraNSLate” No 101108180, and from the Agencia Estatal de Investigación del Ministerio de Ciencia e Innovación (MCIN/AEI/10.13039/501100011033) under grant (PID2021-128131NB-I00) and the European Regional Development Fund (ERDF) “A way of making Europe”. PD is supported by a UKRI Future Leaders Fellowship (grant reference MR/S032223/1).
References
- Abadi, M. G., Navarro, J. F., Steinmetz, M., & Eke, V. R. 2003, ApJ, 597, 21 [NASA ADS] [CrossRef] [Google Scholar]
- Athanassoula, E. 1992, MNRAS, 259, 345 [Google Scholar]
- Athanassoula, E. 2005, MNRAS, 358, 1477 [NASA ADS] [CrossRef] [Google Scholar]
- Athanassoula, E., Laurikainen, E., Salo, H., & Bosma, A. 2015, MNRAS, 454, 3843 [Google Scholar]
- Bacchini, C., Nipoti, C., Iorio, G., et al. 2024, A&A, 687, A115 [NASA ADS] [CrossRef] [EDP Sciences] [Google Scholar]
- Bacon, R., Copin, Y., Monnet, G., et al. 2001, MNRAS, 326, 23 [Google Scholar]
- Bacon, R., Accardo, M., Adjali, L., et al. 2010, in Ground-based and Airborne Instrumentation for Astronomy III, eds. I. S. McLean, S. K. Ramsay, & H. Takami, SPIE Conf. Ser., 7735, 773508 [Google Scholar]
- Barsanti, S., Colless, M., Welker, C., et al. 2022, MNRAS, 516, 3569 [NASA ADS] [CrossRef] [Google Scholar]
- Belfiore, F., Westfall, K. B., Schaefer, A., et al. 2019, AJ, 158, 160 [CrossRef] [Google Scholar]
- Bellstedt, S., Forbes, D. A., Romanowsky, A. J., et al. 2018, MNRAS, 476, 4543 [Google Scholar]
- Bergamini, P., Rosati, P., Mercurio, A., et al. 2019, A&A, 631, A130 [NASA ADS] [CrossRef] [EDP Sciences] [Google Scholar]
- Bik, A., Östlin, G., Hayes, M., Melinder, J., & Menacho, V. 2022, A&A, 666, A161 [NASA ADS] [CrossRef] [EDP Sciences] [Google Scholar]
- Binney, J., & Tremaine, S. 2008, Galactic Dynamics: Second Edition (Princeton, NJ USA: Princeton University Press) [Google Scholar]
- Binney, J., Gerhard, O. E., Stark, A. A., Bally, J., & Uchida, K. I. 1991, MNRAS, 252, 210 [Google Scholar]
- Bittner, A., Falcón-Barroso, J., Nedelchev, B., et al. 2019, A&A, 628, A117 [NASA ADS] [CrossRef] [EDP Sciences] [Google Scholar]
- Bittner, A., Sánchez-Blázquez, P., Gadotti, D. A., et al. 2020, A&A, 643, A65 [NASA ADS] [CrossRef] [EDP Sciences] [Google Scholar]
- Bournaud, F., Powell, L. C., Chapon, D., & Teyssier, R. 2011, in Astrophysical Dynamics: From Stars to Galaxies, eds. N. H. Brummell, A. S. Brun, M. S. Miesch, & Y. Ponty, IAU Symp., 271, 160 [Google Scholar]
- Bureau, M., & Athanassoula, E. 2005, ApJ, 626, 159 [Google Scholar]
- Bureau, M., & Freeman, K. C. 1999, AJ, 118, 126 [NASA ADS] [CrossRef] [Google Scholar]
- Bureau, M., Aronica, G., Athanassoula, E., et al. 2006, MNRAS, 370, 753 [NASA ADS] [CrossRef] [Google Scholar]
- Buta, R. J., Sheth, K., Athanassoula, E., et al. 2015, ApJS, 217, 32 [Google Scholar]
- Calzetti, D. 2001, PASP, 113, 1449 [Google Scholar]
- Calzetti, D., Armus, L., Bohlin, R. C., et al. 2000, ApJ, 533, 682 [NASA ADS] [CrossRef] [Google Scholar]
- Cappellari, M. 2002, MNRAS, 333, 400 [NASA ADS] [CrossRef] [Google Scholar]
- Cappellari, M. 2008, MNRAS, 390, 71 [NASA ADS] [CrossRef] [Google Scholar]
- Cappellari, M. 2017, MNRAS, 466, 798 [Google Scholar]
- Cappellari, M. 2020, MNRAS, 494, 4819 [NASA ADS] [CrossRef] [Google Scholar]
- Cappellari, M., & Copin, Y. 2003, MNRAS, 342, 345 [Google Scholar]
- Cappellari, M., & Emsellem, E. 2004, PASP, 116, 138 [Google Scholar]
- Cappellari, M., Emsellem, E., Bacon, R., et al. 2007, MNRAS, 379, 418 [Google Scholar]
- Cappellari, M., di Serego Alighieri, S., Cimatti, A., et al. 2009, ApJ, 704, L34 [NASA ADS] [CrossRef] [Google Scholar]
- Cappellari, M., Emsellem, E., Krajnović, D., et al. 2011a, MNRAS, 413, 813 [Google Scholar]
- Cappellari, M., Emsellem, E., Krajnović, D., et al. 2011b, MNRAS, 416, 1680 [Google Scholar]
- Cappellari, M., Scott, N., Alatalo, K., et al. 2013, MNRAS, 432, 1709 [Google Scholar]
- Chabrier, G. 2003, PASP, 115, 763 [Google Scholar]
- Choi, H., & Yi, S. K. 2017, ApJ, 837, 68 [NASA ADS] [CrossRef] [Google Scholar]
- Chung, A., & Bureau, M. 2004, AJ, 127, 3192 [NASA ADS] [CrossRef] [Google Scholar]
- Cluver, M. E., Jarrett, T. H., Hopkins, A. M., et al. 2014, ApJ, 782, 90 [Google Scholar]
- Coelho, P., & Gadotti, D. A. 2011, ApJ, 743, L13 [Google Scholar]
- Combes, F., & Sanders, R. H. 1981, A&A, 96, 164 [NASA ADS] [Google Scholar]
- Contopoulos, G., & Papayannopoulos, T. 1980, A&A, 92, 33 [NASA ADS] [Google Scholar]
- Croom, S. M., Lawrence, J. S., Bland-Hawthorn, J., et al. 2012, MNRAS, 421, 872 [NASA ADS] [Google Scholar]
- Davies, J. J., Crain, R. A., Oppenheimer, B. D., & Schaye, J. 2020, MNRAS, 491, 4462 [NASA ADS] [CrossRef] [Google Scholar]
- D’Eugenio, F., Pérez-González, P. G., Maiolino, R., et al. 2024, Nat. Astron., 8, 1443 [CrossRef] [Google Scholar]
- Di Matteo, P., Jog, C. J., Lehnert, M. D., Combes, F., & Semelin, B. 2009, A&A, 501, L9 [NASA ADS] [CrossRef] [EDP Sciences] [Google Scholar]
- Donohoe-Keyes, C. E., Martig, M., James, P. A., & Kraljic, K. 2019, MNRAS, 489, 4992 [Google Scholar]
- Du, M., Shen, J., & Debattista, V. P. 2015, ApJ, 804, 139 [Google Scholar]
- Emsellem, E., Monnet, G., & Bacon, R. 1994a, A&A, 285, 723 [NASA ADS] [Google Scholar]
- Emsellem, E., Monnet, G., Bacon, R., & Nieto, J. L. 1994b, A&A, 285, 739 [NASA ADS] [Google Scholar]
- Emsellem, E., Dejonghe, H., & Bacon, R. 1999, MNRAS, 303, 495 [CrossRef] [Google Scholar]
- Emsellem, E., Cappellari, M., Peletier, R. F., et al. 2004, MNRAS, 352, 721 [Google Scholar]
- Emsellem, E., Schinnerer, E., Santoro, F., et al. 2022, A&A, 659, A191 [NASA ADS] [CrossRef] [EDP Sciences] [Google Scholar]
- Ene, I., Ma, C.-P., McConnell, N. J., et al. 2019, ApJ, 878, 57 [NASA ADS] [CrossRef] [Google Scholar]
- Erwin, P., & Debattista, V. P. 2017, MNRAS, 468, 2058 [Google Scholar]
- Erwin, P., Pohlen, M., & Beckman, J. E. 2008, AJ, 135, 20 [Google Scholar]
- ESO Cpl Development Team 2015, Astrophysics Source Code Library [record ascl:1504.003] [Google Scholar]
- Falcón-Barroso, J., Bacon, R., Bureau, M., et al. 2006, MNRAS, 369, 529 [Google Scholar]
- Fazio, G. G., Hora, J. L., Allen, L. E., et al. 2004, ApJS, 154, 10 [Google Scholar]
- Fisher, D. B., & Drory, N. 2010, ApJ, 716, 942 [NASA ADS] [CrossRef] [Google Scholar]
- Foreman-Mackey, D., Hogg, D. W., Lang, D., & Goodman, J. 2013, PASP, 125, 306 [Google Scholar]
- Fragkoudi, F., Di Matteo, P., Haywood, M., et al. 2017, A&A, 606, A47 [NASA ADS] [CrossRef] [EDP Sciences] [Google Scholar]
- Fragkoudi, F., Grand, R. J. J., Pakmor, R., et al. 2020, MNRAS, 494, 5936 [Google Scholar]
- Fraser-McKelvie, A., van de Sande, J., Gadotti, D. A., et al. 2025, A&A, 700, A237 [NASA ADS] [CrossRef] [EDP Sciences] [Google Scholar]
- Fraternali, F., & Binney, J. J. 2008, MNRAS, 386, 935 [CrossRef] [Google Scholar]
- Freeman, K. C. 1970, ApJ, 160, 811 [Google Scholar]
- Fridman, A. M., Afanasiev, V. L., Dodonov, S. N., et al. 2005, A&A, 430, 67 [NASA ADS] [CrossRef] [EDP Sciences] [Google Scholar]
- Gadotti, D. A., & de Souza, R. E. 2003, ApJ, 583, L75 [NASA ADS] [CrossRef] [Google Scholar]
- Gadotti, D. A., Bittner, A., Falcón-Barroso, J., et al. 2020, A&A, 643, A14 [NASA ADS] [CrossRef] [EDP Sciences] [Google Scholar]
- Gerhard, O. E. 1993, MNRAS, 265, 213 [Google Scholar]
- Granata, G., Caminha, G. B., Ertl, S., et al. 2025, A&A, 697, A94 [NASA ADS] [CrossRef] [EDP Sciences] [Google Scholar]
- Ho, L. C. 2007, ApJ, 668, 94 [Google Scholar]
- Ho, S. H., Martin, C. L., & Turner, M. L. 2019, ApJ, 875, 54 [NASA ADS] [CrossRef] [Google Scholar]
- Hohl, F. 1971, ApJ, 168, 343 [NASA ADS] [CrossRef] [Google Scholar]
- Hopkins, P. F., Croton, D., Bundy, K., et al. 2010, ApJ, 724, 915 [Google Scholar]
- Iannuzzi, F., & Athanassoula, E. 2015, MNRAS, 450, 2514 [Google Scholar]
- Jeans, J. H. 1922, MNRAS, 82, 122 [NASA ADS] [CrossRef] [Google Scholar]
- Jethwa, P., Thater, S., Maindl, T., & Van de Ven, G. 2020, DYNAMITE: DYnamics, Age and Metallicity Indicators Tracing Evolution, Astrophysics Source Code Library [record ascl:2011.007] [Google Scholar]
- Kalinova, V., van de Ven, G., Lyubenova, M., et al. 2017, MNRAS, 464, 1903 [Google Scholar]
- Khan, R. 2017, ApJS, 228, 5 [NASA ADS] [CrossRef] [Google Scholar]
- Kim, T., Gadotti, D. A., Athanassoula, E., et al. 2016, MNRAS, 462, 3430 [Google Scholar]
- Kim, T., Gadotti, D. A., Lee, Y. H., et al. 2024, ApJ, 976, 220 [Google Scholar]
- Krajnović, D., Cappellari, M., Emsellem, E., McDermid, R. M., & de Zeeuw, P. T. 2005, MNRAS, 357, 1113 [CrossRef] [Google Scholar]
- Krajnović, D., Weilbacher, P. M., Urrutia, T., et al. 2015, MNRAS, 452, 2 [Google Scholar]
- Kruk, S. J., Erwin, P., Debattista, V. P., & Lintott, C. 2019, MNRAS, 490, 4721 [Google Scholar]
- Lablanche, P.-Y., Cappellari, M., Emsellem, E., et al. 2012, MNRAS, 424, 1495 [NASA ADS] [CrossRef] [Google Scholar]
- Lagos, C. d. P., Theuns, T., Stevens, A. R. H., et al. 2017, MNRAS, 464, 3850 [Google Scholar]
- Lagos, C. d. P., Emsellem, E., van de Sande, J., et al. 2022, MNRAS, 509, 4372 [Google Scholar]
- Laurikainen, E., Salo, H., Athanassoula, E., Bosma, A., & Herrera-Endoqui, M. 2014, MNRAS, 444, L80 [Google Scholar]
- Leung, G. Y. C., Leaman, R., van de Ven, G., et al. 2018, MNRAS, 477, 254 [Google Scholar]
- Li, H., Li, R., Mao, S., et al. 2016, MNRAS, 455, 3680 [CrossRef] [Google Scholar]
- Li, H., Ge, J., Mao, S., et al. 2017, ApJ, 838, 77 [NASA ADS] [CrossRef] [Google Scholar]
- Li, Z.-Y., Shen, J., Bureau, M., et al. 2018, ApJ, 854, 65 [Google Scholar]
- Lütticke, R., Dettmar, R. J., & Pohlen, M. 2000a, A&AS, 145, 405 [NASA ADS] [CrossRef] [EDP Sciences] [Google Scholar]
- Lütticke, R., Dettmar, R. J., & Pohlen, M. 2000b, A&A, 362, 435 [Google Scholar]
- Makarov, D., Prugniel, P., Terekhova, N., Courtois, H., & Vauglin, I. 2014, A&A, 570, A13 [NASA ADS] [CrossRef] [EDP Sciences] [Google Scholar]
- Martis, N. S., Marchesini, D. M., Muzzin, A., et al. 2019, ApJ, 882, 65 [NASA ADS] [CrossRef] [Google Scholar]
- Melchior, A. L., Combes, F., & Gould, A. 2007, A&A, 462, 965 [NASA ADS] [CrossRef] [EDP Sciences] [Google Scholar]
- Méndez-Abreu, J., de Lorenzo-Cáceres, A., Gadotti, D. A., et al. 2019, MNRAS, 482, L118 [Google Scholar]
- Mitzkus, M., Cappellari, M., & Walcher, C. J. 2017, MNRAS, 464, 4789 [Google Scholar]
- Monnet, G., Bacon, R., & Emsellem, E. 1992, A&A, 253, 366 [NASA ADS] [Google Scholar]
- Naab, T., Johansson, P. H., & Ostriker, J. P. 2009, ApJ, 699, L178 [Google Scholar]
- Navarro, J. F., Frenk, C. S., & White, S. D. M. 1997, ApJ, 490, 493 [Google Scholar]
- Neumann, J., Wisotzki, L., Choudhury, O. S., et al. 2017, A&A, 604, A30 [NASA ADS] [CrossRef] [EDP Sciences] [Google Scholar]
- Nevin, R., Blecha, L., Comerford, J., et al. 2023, MNRAS, 522, 1 [NASA ADS] [CrossRef] [Google Scholar]
- Noguchi, M. 1987, MNRAS, 228, 635 [NASA ADS] [Google Scholar]
- Ostriker, J. P., & Peebles, P. J. E. 1973, ApJ, 186, 467 [Google Scholar]
- Pappalardo, C., Bendo, G. J., Boquien, M., et al. 2021, A&A, 655, A104 [NASA ADS] [CrossRef] [EDP Sciences] [Google Scholar]
- Patsis, P. A., & Xilouris, E. M. 2006, MNRAS, 366, 1121 [Google Scholar]
- Persic, M., Salucci, P., & Stel, F. 1996, MNRAS, 281, 27 [Google Scholar]
- Piner, B. G., Stone, J. M., & Teuben, P. J. 1995, ApJ, 449, 508 [NASA ADS] [CrossRef] [Google Scholar]
- Rutherford, T. H., Croom, S. M., van de Sande, J., et al. 2021, ApJ, 918, 84 [NASA ADS] [CrossRef] [Google Scholar]
- Rutherford, T. H., van de Sande, J., Croom, S. M., et al. 2024, MNRAS, 529, 810 [NASA ADS] [CrossRef] [Google Scholar]
- Sales, L. V., Navarro, J. F., Theuns, T., et al. 2012, MNRAS, 423, 1544 [Google Scholar]
- Salo, H. 1991, A&A, 243, 118 [NASA ADS] [Google Scholar]
- Salo, H., Laurikainen, E., Laine, J., et al. 2015, ApJS, 219, 4 [Google Scholar]
- Schulze, F., Remus, R.-S., Dolag, K., et al. 2020, MNRAS, 493, 3778 [Google Scholar]
- Schwarzschild, M. 1979, ApJ, 232, 236 [NASA ADS] [CrossRef] [Google Scholar]
- Scott, N., Fogarty, L. M. R., Owers, M. S., et al. 2015, MNRAS, 451, 2723 [Google Scholar]
- Sellwood, J. A., & Wilkinson, A. 1993, Rep. Prog. Phys., 56, 173 [NASA ADS] [CrossRef] [Google Scholar]
- Seo, W.-Y., Kim, W.-T., Kwak, S., et al. 2019, ApJ, 872, 5 [NASA ADS] [CrossRef] [Google Scholar]
- Sheth, K., Vogel, S. N., Regan, M. W., Thornley, M. D., & Teuben, P. J. 2005, ApJ, 632, 217 [NASA ADS] [CrossRef] [Google Scholar]
- Sheth, K., Regan, M., Hinz, J. L., et al. 2010, PASP, 122, 1397 [Google Scholar]
- Skokos, C., Patsis, P. A., & Athanassoula, E. 2002a, MNRAS, 333, 847 [Google Scholar]
- Skokos, C., Patsis, P. A., & Athanassoula, E. 2002b, MNRAS, 333, 861 [NASA ADS] [CrossRef] [Google Scholar]
- Steinmetz, M., & Navarro, J. F. 2002, New A, 7, 155 [NASA ADS] [CrossRef] [Google Scholar]
- Tacchella, S., Smith, A., Kannan, R., et al. 2022, MNRAS, 513, 2904 [NASA ADS] [CrossRef] [Google Scholar]
- Tahmasebzadeh, B., Zhu, L., Shen, J., Gerhard, O., & van de Ven, G. 2022, ApJ, 941, 109 [NASA ADS] [CrossRef] [Google Scholar]
- Tahmasebzadeh, B., Zhu, L., Shen, J., et al. 2024, MNRAS, 534, 861 [NASA ADS] [CrossRef] [Google Scholar]
- Tikhonenko, I. S., Smirnov, A. A., & Sotnikova, N. Y. 2021, A&A, 648, L4 [NASA ADS] [CrossRef] [EDP Sciences] [Google Scholar]
- Tully, R. B., Kourkchi, E., Courtois, H. M., et al. 2023, ApJ, 944, 94 [NASA ADS] [CrossRef] [Google Scholar]
- Übler, H., Naab, T., Oser, L., et al. 2014, MNRAS, 443, 2092 [CrossRef] [Google Scholar]
- Valluri, M., Shen, J., Abbott, C., & Debattista, V. P. 2016, ApJ, 818, 141 [Google Scholar]
- van de Sande, J., Bland-Hawthorn, J., Fogarty, L. M. R., et al. 2017, ApJ, 835, 104 [Google Scholar]
- van de Sande, J., Fraser-McKelvie, A., Fisher, D. B., et al. 2024, in Early Disk-Galaxy Formation from JWST to the Milky Way, eds. F. Tabatabaei, B. Barbuy, & Y. S. Ting, IAU Symp., 377, 27 [Google Scholar]
- van den Bosch, R. C. E., van de Ven, G., Verolme, E. K., Cappellari, M., & de Zeeuw, P. T. 2008, MNRAS, 385, 647 [Google Scholar]
- van der Marel, R. P., & Franx, M. 1993, ApJ, 407, 525 [Google Scholar]
- Vasiliev, E. 2013, MNRAS, 434, 3174 [Google Scholar]
- Vasiliev, E., & Valluri, M. 2020, ApJ, 889, 39 [Google Scholar]
- Verro, K., Trager, S. C., Peletier, R. F., et al. 2022, A&A, 660, A34 [NASA ADS] [CrossRef] [EDP Sciences] [Google Scholar]
- Verwilghen, P., Emsellem, E., Renaud, F., et al. 2024, A&A, 687, A53 [NASA ADS] [CrossRef] [EDP Sciences] [Google Scholar]
- Weilbacher, P. M., Palsa, R., Streicher, O., et al. 2020, A&A, 641, A28 [NASA ADS] [CrossRef] [EDP Sciences] [Google Scholar]
- Westfall, K. B., Cappellari, M., Bershady, M. A., et al. 2019, AJ, 158, 231 [Google Scholar]
- White, S. D. M., & Rees, M. J. 1978, MNRAS, 183, 341 [Google Scholar]
- Wilman, D. J., Fontanot, F., De Lucia, G., Erwin, P., & Monaco, P. 2013, MNRAS, 433, 2986 [Google Scholar]
- Wozniak, H. 2015, A&A, 575, A7 [Google Scholar]
- Zhu, K., Lu, S., Cappellari, M., et al. 2023, MNRAS, 522, 6326 [NASA ADS] [CrossRef] [Google Scholar]
Appendix A: JAM models
In this section we present JAM model maps for galaxies NGC 3279, NGC 5775, NGC 0360, and UGC 00903, in Figs. A.1-A.4. The left column shows Vrms, V and σ derived from nGIST output for the seven GECKOS galaxies, the central column shows the same but from the JAM model, and the right column shows the residuals, i.e. data minus model. The velocity residuals for these galaxies do not show clear non-axisymmetric structure.
All Tables
All Figures
|
Fig. 1. Spitzer IRAC 3.6 μm imaging of our sample of seven GECKOS galaxies. The images are scaled with an inverse hyperbolic sine (arcsinh) scaling, and masked regions (bright stars, imaging artefacts) are shown in white. There are clear star-forming spiral arms in NGC 5775 and NGC 0360. |
| In the text | |
|
Fig. 2. MGE fit to the galaxy IC 1711. Spitzer 3.6 μm imaging contours are in black, the MGE model contours are in red, and masked regions (other sources) are in yellow. The contours are spaced by 0.5 mag arcsec−2. The right-side panel is a zoomed-in version of the left-side panel, with the scale shown by a box around the central region in the left-side panel. |
| In the text | |
|
Fig. 3. Illustration of masking for two E(B − V) thresholds across our sample, overlaid on the V maps. Each row corresponds to a galaxy, ordered from top to bottom by decreasing star formation rate. The left column shows masks where Voronoi bins with E(B − V) > 0.7 are excluded (greyed out), while the right column shows masks for E(B − V) > 0.2. Galaxies are also labelled with their star formation rates in M⊙ yr−1. We show the range in the velocity colour bar in the bottom right of the right-side panels. Aggressive masking removes most mid-plane bins in highly star-forming galaxies. |
| In the text | |
|
Fig. 4. JAM model for galaxy NGC 3957. The upper row shows the Vrms map, the central row shows the V map, and the lower row shows the σ map. The left column shows nGIST mean light-weighted velocity V and σ binned to S/N = 100, as well as the derived quantity |
| In the text | |
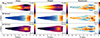 |
Fig. 5. Same as Fig. 4, but for IC 1711 and without the circling of structures. |
| In the text | |
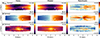 |
Fig. 6. Same as Fig. 4, but for NGC 0522 and without the circling of structures. |
| In the text | |
|
Fig. 7. Moving-average χreduced2 value for each galaxy in our sample, plotted as a function of R/Rd, where Rd is the disc scale length. For each galaxy and each dust masking cut-off, we measure χreduced2 in a 0.5 × Rd bin, spaced in radius along the major axis. χreduced2 = 1 is represented by a dotted line, and Rd = 0.5 (bulge-dominated region, e.g. Fisher & Drory 2010) and Rd = 2.2 (disc-dominated region, (e.g. Freeman 1970; Persic et al. 1996)) are represented by vertical dashed lines. We also plot in grey the χreduced2 measure for our E(B − V) ≤ 0.7 model, but applied to E(B − V) ≤ 0.2 bins. Dotted blue lines are plotted at 3.5 kpc for IC 1711 and at 2.5 kpc for NGC 3957, the radius at which their photometric shoulders end (see Sect. 5.2.1). We note that NGC 5775 and NGC 0360 are not perfectly edge-on and show clear spiral arms in their photometry. This explains their strong peaks in χreduced2. A general trend of decreasing χreduced2 with mask level is shown, as well as discs fit better than bulges. |
| In the text | |
|
Fig. 8. Velocity maps for all seven galaxies in our sample, demonstrating the effect of symmetrisation within the JAM model. The leftmost column shows the observed velocity (V) maps. The Vsym column presents the same velocity maps after applying the symmetrisation procedure used by the JAM model. The V − Vsym column shows the residuals between the observed and symmetrised velocities. The V − Vmodel column shows the residuals between the observed velocity and the best-fitting JAM model (with a mask of E(B − V) < 0.7). Finally, The Vsym − Vmodel column shows the residuals between the symmetrised velocity field and the JAM model. Our diagnosis of non-axisymmetric velocity structures consider only features that are also clearly visible in the Vsym − Vmodel residuals, as these are unaffected by the symmetrisation process. |
| In the text | |
|
Fig. 9. Stellar velocities and surface brightness profiles for NGC 3957 and IC 1711. For NGC 3957, panels (a), (c), and (e) show velocities extracted from horizontal slits parallel to the major axis, with the data in orange and the model in purple. Panel (a) shows a slit offset from the major axis by 0.75 kpc, panel (c) by 0.1 kpc, and panel (e) by 0 kpc. Panels (b), (d), and (f) show the residual velocity from the slits in the panels above, (a), (c), and (e) respectively. Panel (g) shows the surface brightness profiles from Spitzer IRAC 3.6 μm imaging. The total flux summed along the minor axis for each point along the major axis is shown in blue, and the flux along the major axis is shown in red. The dashed black vertical lines at ±2.5 kpc indicate where the photometric shoulders in the major axis profile end. The same is shown for IC 1711 with panels (h), (j), and (l) indicating corresponding velocities; (i), (k), and (m) indicating residuals; and panel (n) indicating surface brightness profiles. Dashed black vertical lines shown at 3.5 kpc indicate where the photometric shoulders end. |
| In the text | |
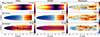 |
Fig. A.1. Same as Fig. 4, but for NGC 3279 and without the circling of structure. |
| In the text | |
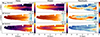 |
Fig. A.2. Same as Fig. 4, but for NGC 5775 and without the circling of structure. |
| In the text | |
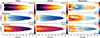 |
Fig. A.3. Same as Fig. 4, but for NGC 0360 and without the circling of structure. |
| In the text | |
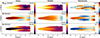 |
Fig. A.4. Same as Fig. 4, but for UGC 00903 and without the circling of structure. |
| In the text | |
Current usage metrics show cumulative count of Article Views (full-text article views including HTML views, PDF and ePub downloads, according to the available data) and Abstracts Views on Vision4Press platform.
Data correspond to usage on the plateform after 2015. The current usage metrics is available 48-96 hours after online publication and is updated daily on week days.
Initial download of the metrics may take a while.