Fig. 4.
Download original image
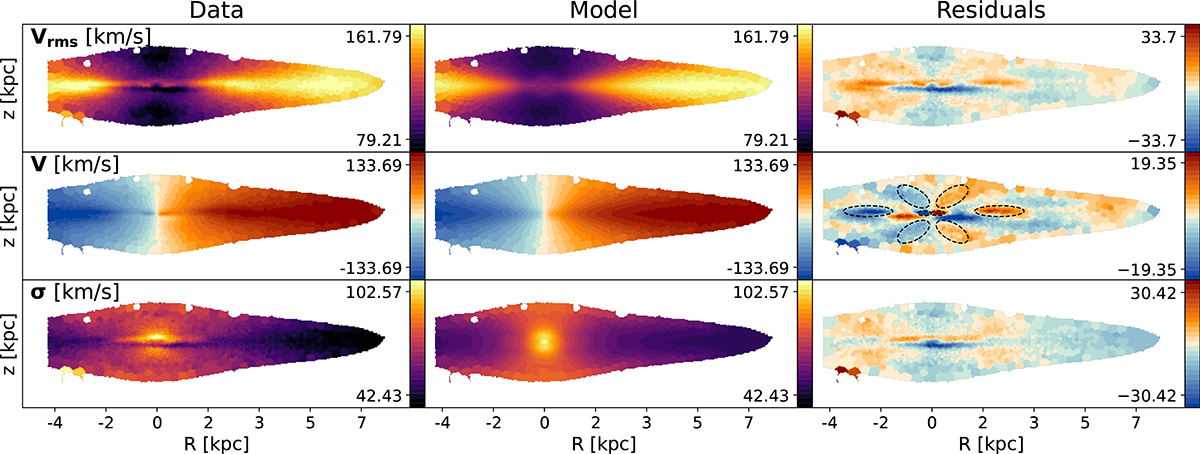
JAM model for galaxy NGC 3957. The upper row shows the Vrms map, the central row shows the V map, and the lower row shows the σ map. The left column shows nGIST mean light-weighted velocity V and σ binned to S/N = 100, as well as the derived quantity ![]() . The central column shows the dynamical model, and the right column shows the residuals (data minus model). The model is fit to the Vrms map, and a κ value is fit to find the V map from Vrms. Additionally, we circle structures in the V residual map that we believe corresponds to kinematic components, which JAM failed to successfully model.
. The central column shows the dynamical model, and the right column shows the residuals (data minus model). The model is fit to the Vrms map, and a κ value is fit to find the V map from Vrms. Additionally, we circle structures in the V residual map that we believe corresponds to kinematic components, which JAM failed to successfully model.
Current usage metrics show cumulative count of Article Views (full-text article views including HTML views, PDF and ePub downloads, according to the available data) and Abstracts Views on Vision4Press platform.
Data correspond to usage on the plateform after 2015. The current usage metrics is available 48-96 hours after online publication and is updated daily on week days.
Initial download of the metrics may take a while.