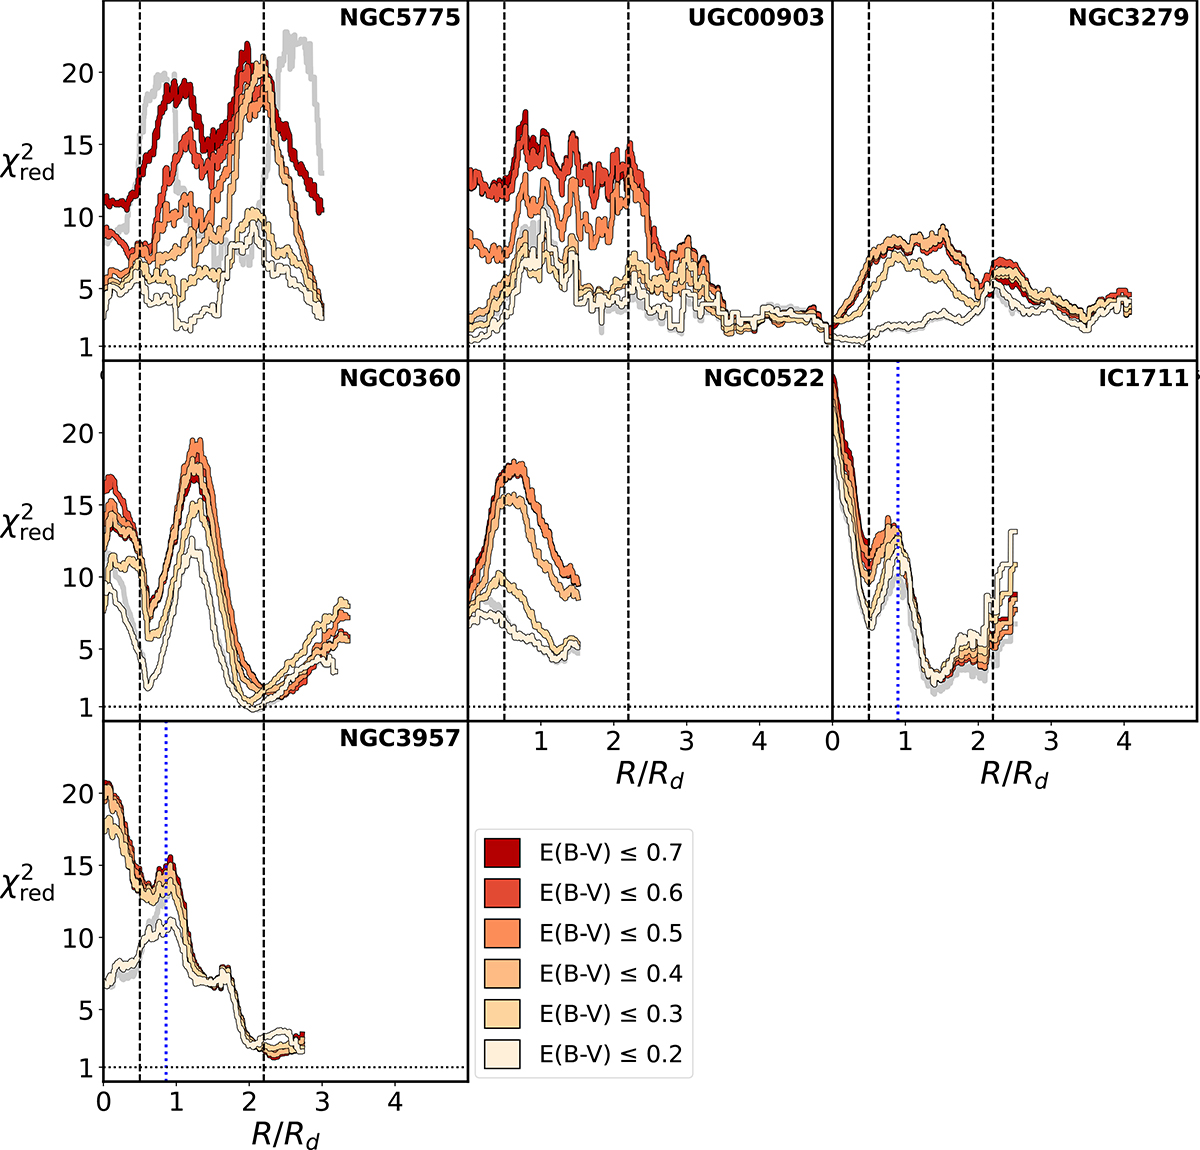
Fig. 7.
Download original image
Moving-average χreduced2 value for each galaxy in our sample, plotted as a function of R/Rd, where Rd is the disc scale length. For each galaxy and each dust masking cut-off, we measure χreduced2 in a 0.5 × Rd bin, spaced in radius along the major axis. χreduced2 = 1 is represented by a dotted line, and Rd = 0.5 (bulge-dominated region, e.g. Fisher & Drory 2010) and Rd = 2.2 (disc-dominated region, (e.g. Freeman 1970; Persic et al. 1996)) are represented by vertical dashed lines. We also plot in grey the χreduced2 measure for our E(B − V) ≤ 0.7 model, but applied to E(B − V) ≤ 0.2 bins. Dotted blue lines are plotted at 3.5 kpc for IC 1711 and at 2.5 kpc for NGC 3957, the radius at which their photometric shoulders end (see Sect. 5.2.1). We note that NGC 5775 and NGC 0360 are not perfectly edge-on and show clear spiral arms in their photometry. This explains their strong peaks in χreduced2. A general trend of decreasing χreduced2 with mask level is shown, as well as discs fit better than bulges.
Current usage metrics show cumulative count of Article Views (full-text article views including HTML views, PDF and ePub downloads, according to the available data) and Abstracts Views on Vision4Press platform.
Data correspond to usage on the plateform after 2015. The current usage metrics is available 48-96 hours after online publication and is updated daily on week days.
Initial download of the metrics may take a while.