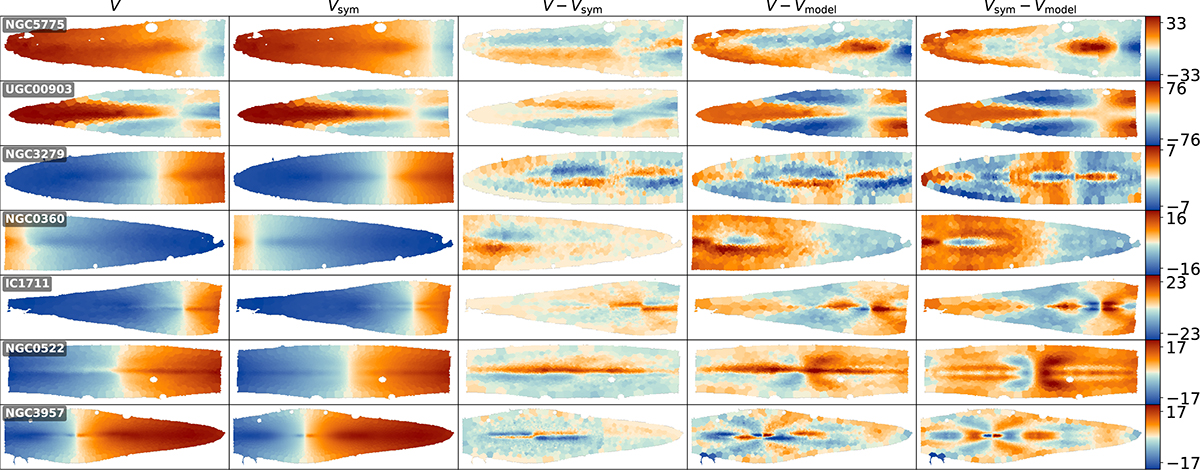
Fig. 8.
Download original image
Velocity maps for all seven galaxies in our sample, demonstrating the effect of symmetrisation within the JAM model. The leftmost column shows the observed velocity (V) maps. The Vsym column presents the same velocity maps after applying the symmetrisation procedure used by the JAM model. The V − Vsym column shows the residuals between the observed and symmetrised velocities. The V − Vmodel column shows the residuals between the observed velocity and the best-fitting JAM model (with a mask of E(B − V) < 0.7). Finally, The Vsym − Vmodel column shows the residuals between the symmetrised velocity field and the JAM model. Our diagnosis of non-axisymmetric velocity structures consider only features that are also clearly visible in the Vsym − Vmodel residuals, as these are unaffected by the symmetrisation process.
Current usage metrics show cumulative count of Article Views (full-text article views including HTML views, PDF and ePub downloads, according to the available data) and Abstracts Views on Vision4Press platform.
Data correspond to usage on the plateform after 2015. The current usage metrics is available 48-96 hours after online publication and is updated daily on week days.
Initial download of the metrics may take a while.