Fig. 9.
Download original image
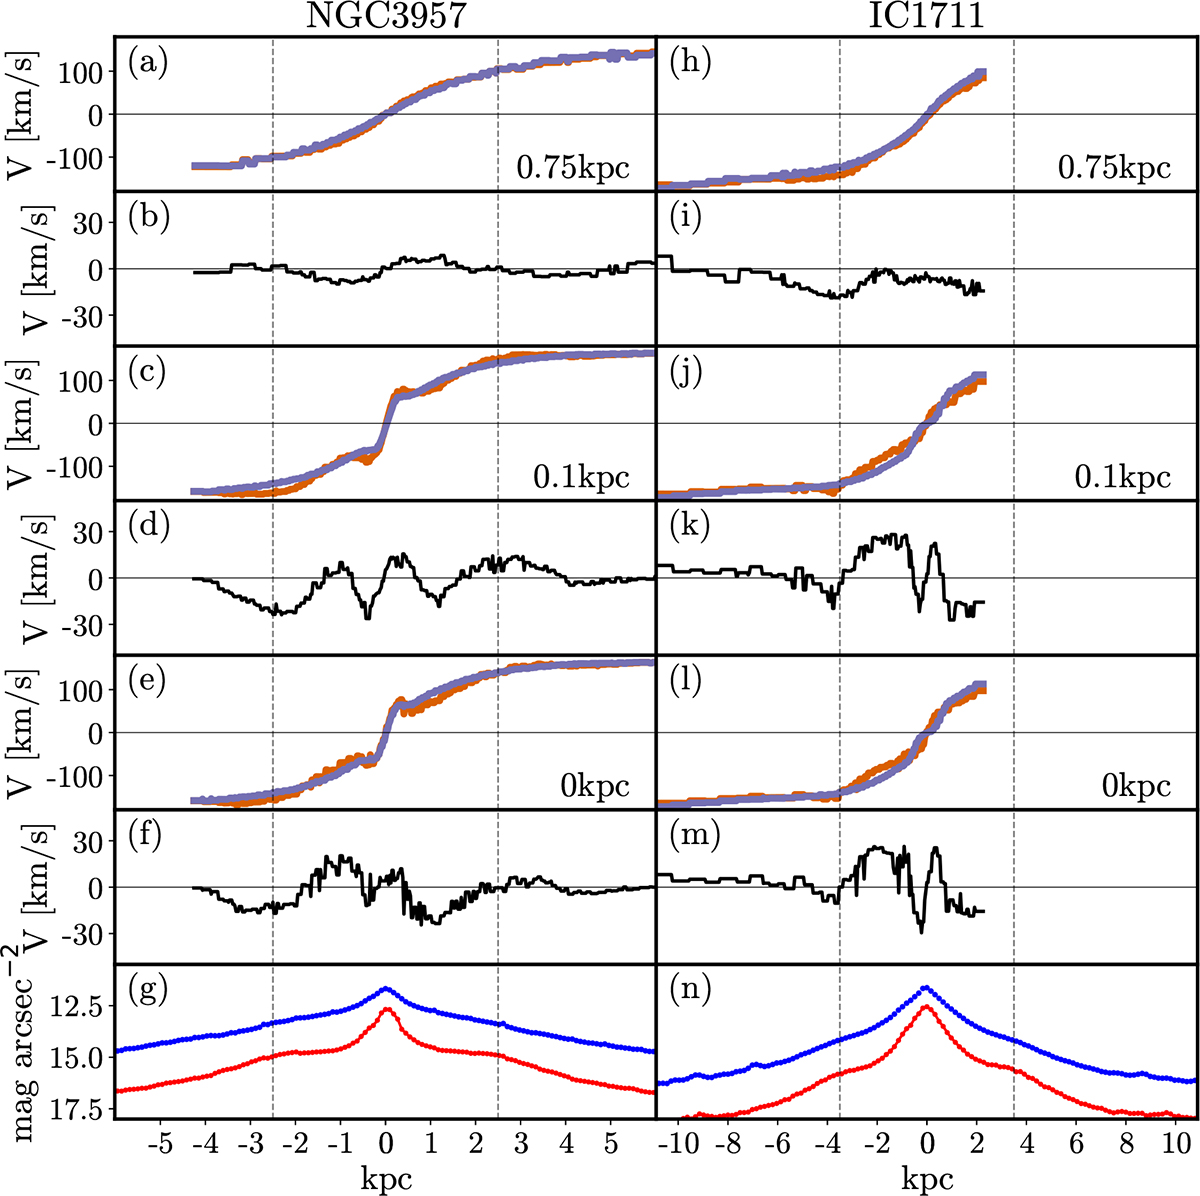
Stellar velocities and surface brightness profiles for NGC 3957 and IC 1711. For NGC 3957, panels (a), (c), and (e) show velocities extracted from horizontal slits parallel to the major axis, with the data in orange and the model in purple. Panel (a) shows a slit offset from the major axis by 0.75 kpc, panel (c) by 0.1 kpc, and panel (e) by 0 kpc. Panels (b), (d), and (f) show the residual velocity from the slits in the panels above, (a), (c), and (e) respectively. Panel (g) shows the surface brightness profiles from Spitzer IRAC 3.6 μm imaging. The total flux summed along the minor axis for each point along the major axis is shown in blue, and the flux along the major axis is shown in red. The dashed black vertical lines at ±2.5 kpc indicate where the photometric shoulders in the major axis profile end. The same is shown for IC 1711 with panels (h), (j), and (l) indicating corresponding velocities; (i), (k), and (m) indicating residuals; and panel (n) indicating surface brightness profiles. Dashed black vertical lines shown at 3.5 kpc indicate where the photometric shoulders end.
Current usage metrics show cumulative count of Article Views (full-text article views including HTML views, PDF and ePub downloads, according to the available data) and Abstracts Views on Vision4Press platform.
Data correspond to usage on the plateform after 2015. The current usage metrics is available 48-96 hours after online publication and is updated daily on week days.
Initial download of the metrics may take a while.