Fig. 1.
Download original image
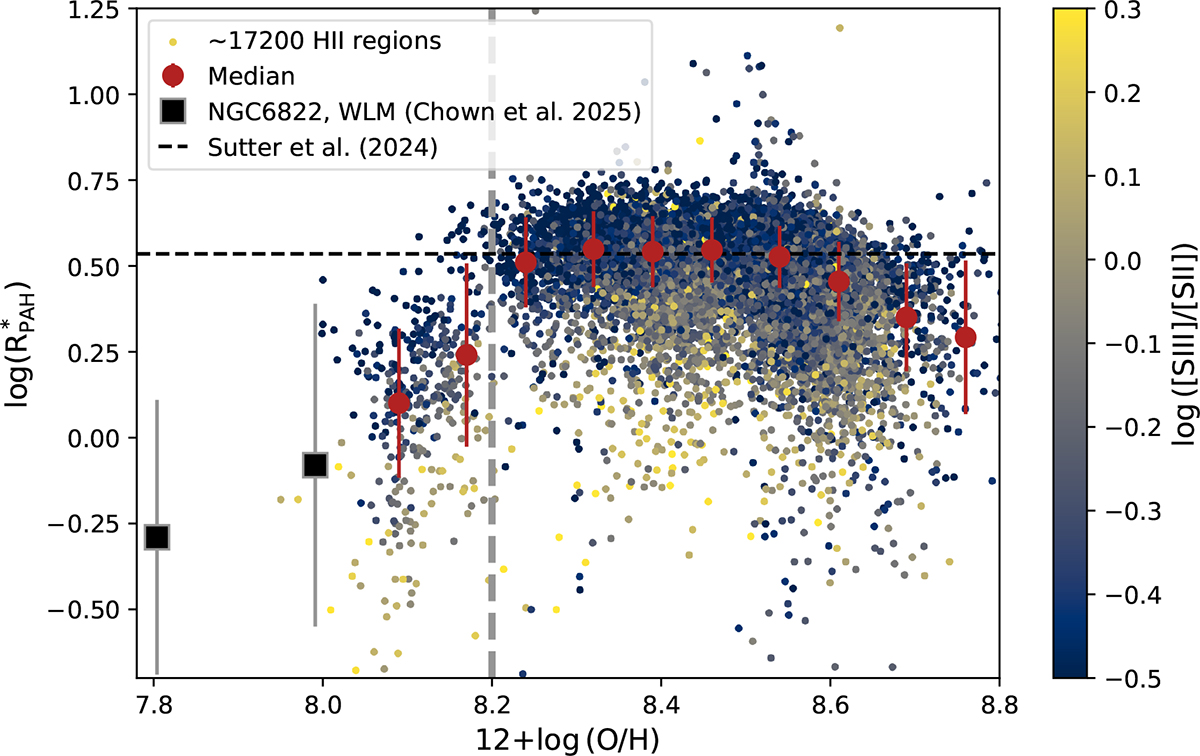
Distribution of log(RPAH*) vs. oxygen abundance color-coded by log([SIII]/[SII]) (tracer of the ionization parameter) for all H II regions in the sample. The red circles show the average values in different metallicity bins (reported in Table 2). The vertical gray dashed line marks 12 + log(O/H) = 8.2 as a threshold between the low- and high-metallicity regimes. The horizontal dashed line corresponds to the average RPAH for diffuse ISM measured by Sutter et al. (2024). The black squares correspond to measurements for WLM and NGC6822 (from low- to high-metallicity) made by (Chown et al. 2025a) using JWST F770W and F2100W images. The PAH fraction drops significantly in the low-metallicity regime.
Current usage metrics show cumulative count of Article Views (full-text article views including HTML views, PDF and ePub downloads, according to the available data) and Abstracts Views on Vision4Press platform.
Data correspond to usage on the plateform after 2015. The current usage metrics is available 48-96 hours after online publication and is updated daily on week days.
Initial download of the metrics may take a while.