Fig. A.1.
Download original image
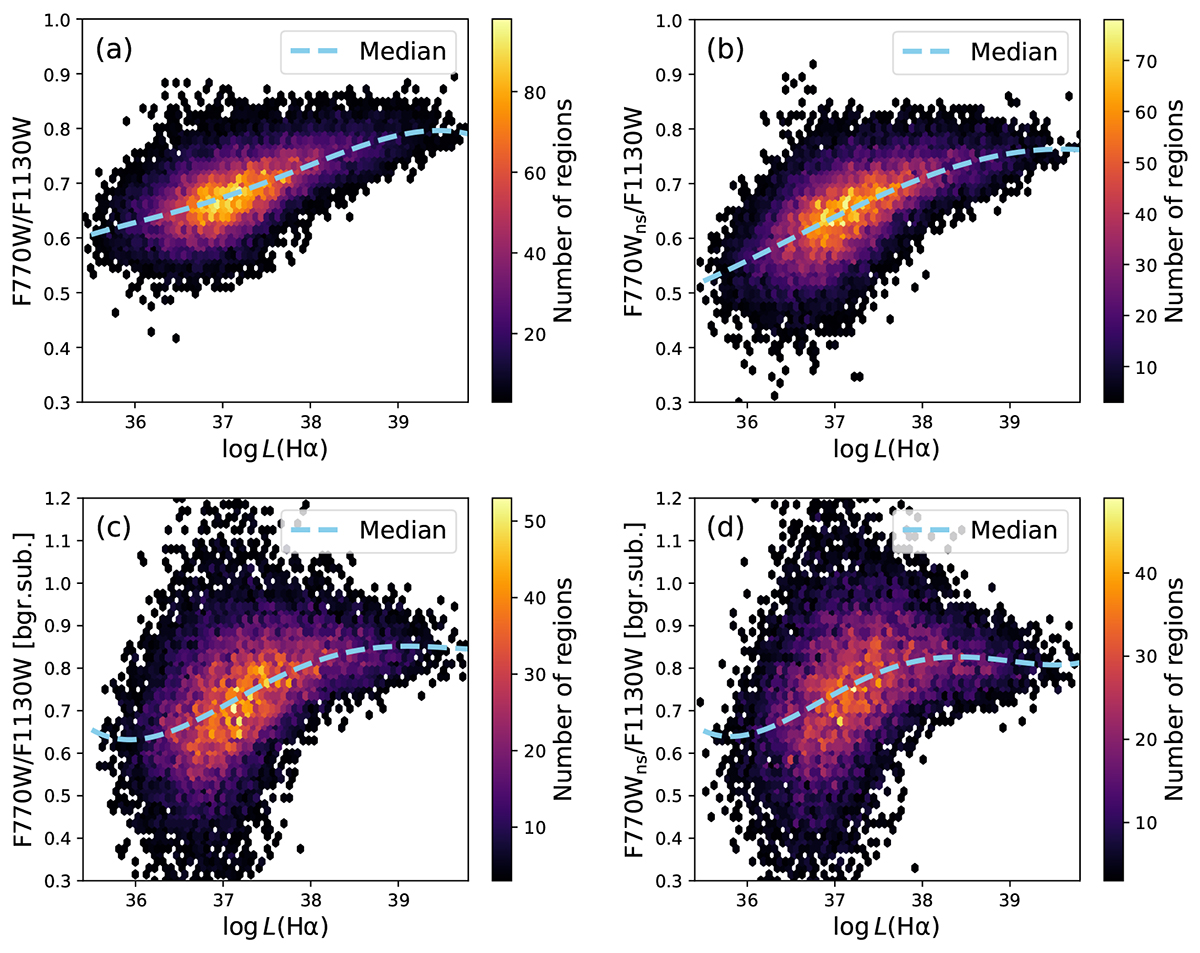
Band ratio F770W/F2100W grows with the Hα luminosity of the H II regions. This effect is seen for both observed (panel a) and stellar continuum subtracted (panel b) data in F770W. Panels c and d show the same line ratios after local background subtraction. The color denotes the number density of the regions, and the cyan curve represents a smoothed running median across the Hα luminosities.
Current usage metrics show cumulative count of Article Views (full-text article views including HTML views, PDF and ePub downloads, according to the available data) and Abstracts Views on Vision4Press platform.
Data correspond to usage on the plateform after 2015. The current usage metrics is available 48-96 hours after online publication and is updated daily on week days.
Initial download of the metrics may take a while.