Fig. B.1.
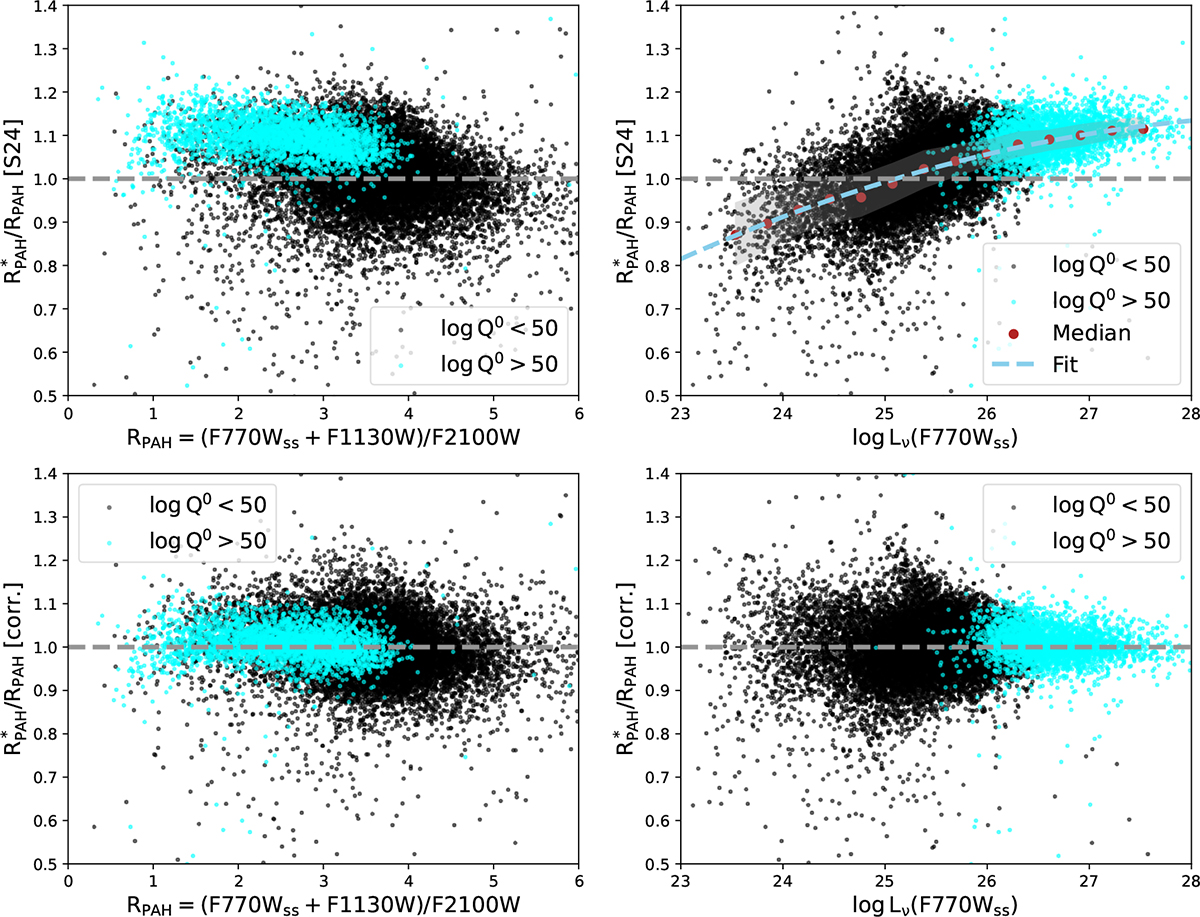
Download original image
Ratio of two tracers of PAH mass fraction (RPAH and RPAH*) for ∼12000 H II regions from 19 PHANGS galaxies (top row) depending on RPAH (left panel) and monochromatic luminosity Lν(F770Wss) (right panel). Cyan and black denote regions with hydrogen ionizing photons rate Q0 > 1050 s−1 and Q0 < 1050 s−1, respectively. RPAH* and RPAH are consistent with each other for most of the regions, but RPAH* systematically overestimates PAH fraction for the luminous H II regions. The bottom row demonstrates the same ratio with RPAH* calculated after applying correction described in the text.
Current usage metrics show cumulative count of Article Views (full-text article views including HTML views, PDF and ePub downloads, according to the available data) and Abstracts Views on Vision4Press platform.
Data correspond to usage on the plateform after 2015. The current usage metrics is available 48-96 hours after online publication and is updated daily on week days.
Initial download of the metrics may take a while.