Fig. 2.
Download original image
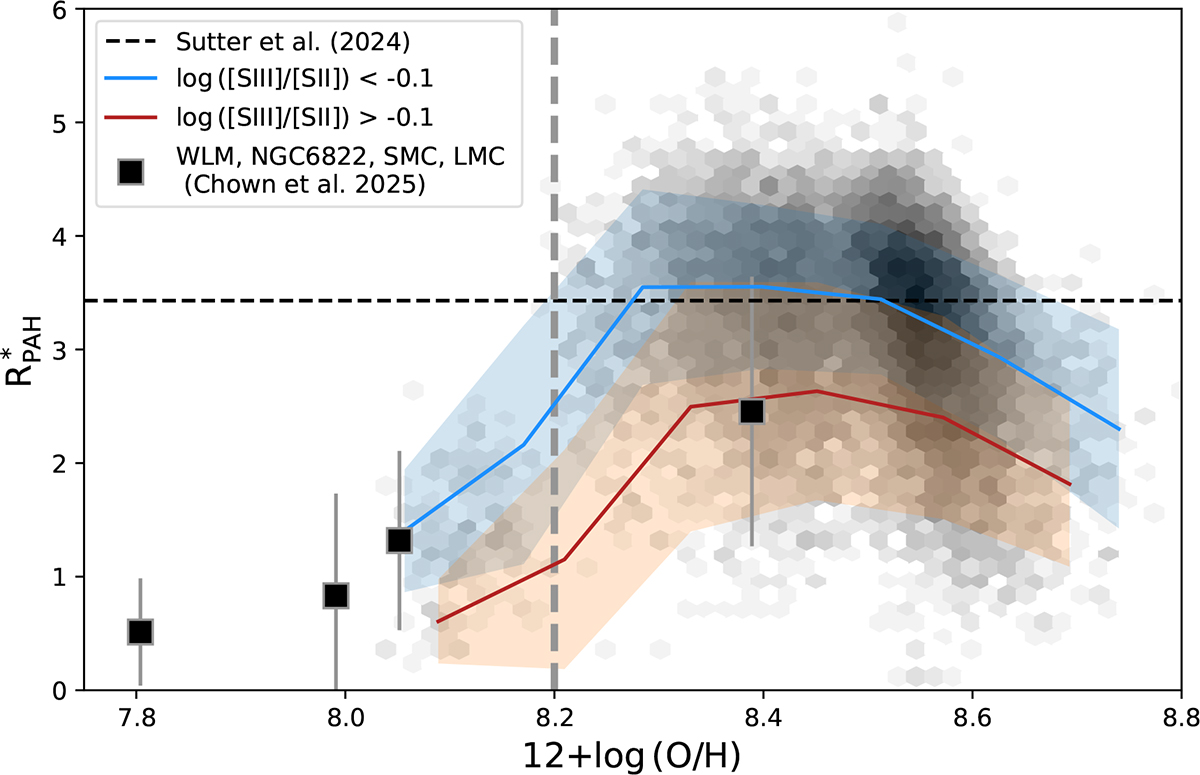
Distribution of RPAH* vs. oxygen abundance for the entire sample of H II regions (gray histogram with intensity tracing the probability density), and average distribution for two bins in log([S III]/[S II]). The dashed lines are the same as in Fig. 1. The black squares represent measurements for WLM, NGC6822 (as in Fig. 1), the SMC, and the LMC from Chown et al. (2025a), listed in order of increasing metallicity. Spitzer IRAC4 and MIPS24 filters were used to estimate RPAH* for the SMC and LMC (Chown et al. 2025a).
Current usage metrics show cumulative count of Article Views (full-text article views including HTML views, PDF and ePub downloads, according to the available data) and Abstracts Views on Vision4Press platform.
Data correspond to usage on the plateform after 2015. The current usage metrics is available 48-96 hours after online publication and is updated daily on week days.
Initial download of the metrics may take a while.