Fig. 5.
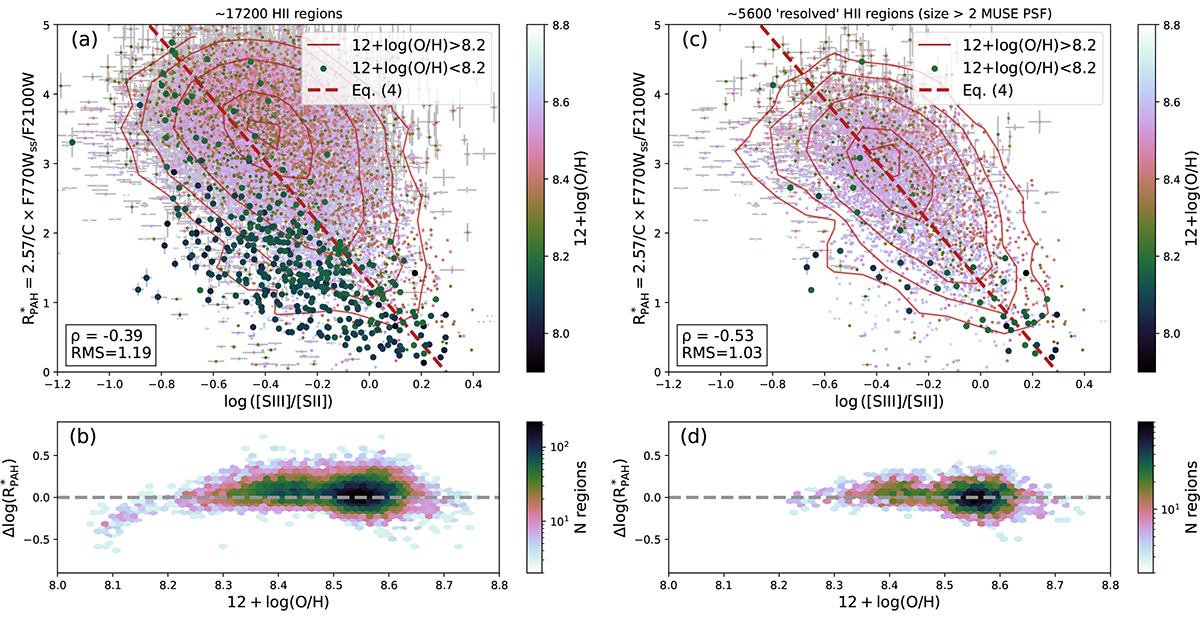
Download original image
PAH fraction anti-correlates with log([S III]/[S II]) (ionization parameter tracer) for thousands of H II regions in 42 PHANGS-JWST galaxies. Panels (a, b) shows all ∼17 200 analyzed H II regions, while the ∼5600 brightest resolved H II regions are shown in panels (c, d). The dashed red line shows the best-fit linear regression to the resolved sample defined by Eq. (4). The histograms in panels (b, d) show how the logarithmic residuals after subtracting this linear trend depend on metallicity. The color in panels (a, c) denotes gas-phase oxygen abundance; the red contours show the probability density of the high-metallicity (12 + log(O/H) > 8.2) points; the levels correspond to 50, 65, 80, 95, and 99 percentile intervals. The Spearman correlation coefficient (ρ) and RMS scatter around the linear fit are reported in panels (a, c).
Current usage metrics show cumulative count of Article Views (full-text article views including HTML views, PDF and ePub downloads, according to the available data) and Abstracts Views on Vision4Press platform.
Data correspond to usage on the plateform after 2015. The current usage metrics is available 48-96 hours after online publication and is updated daily on week days.
Initial download of the metrics may take a while.