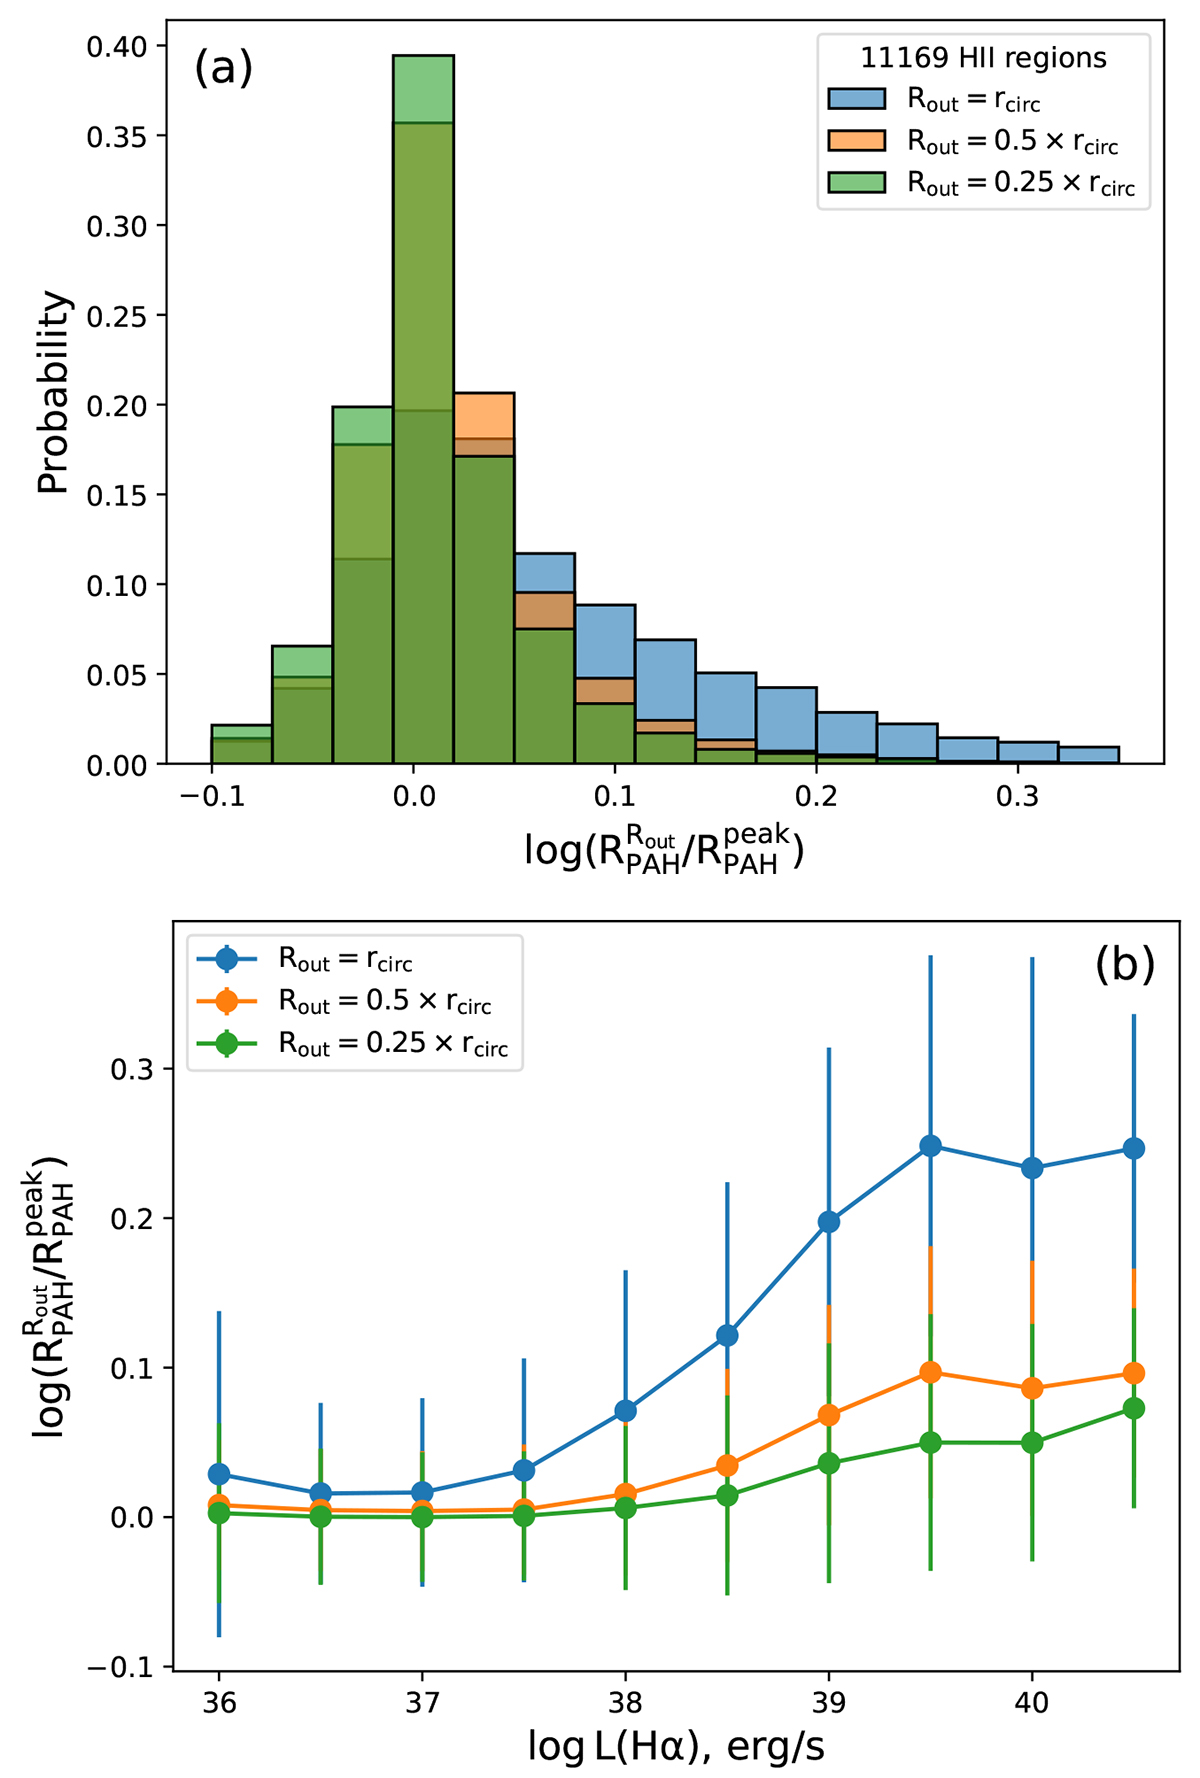
Fig. 7.
Download original image
About 45% of the RPAH measurements are overestimated by more than 10% when measured in the MUSE-based apertures for H II regions compared to the values in their centers. Panel (a) shows the probability distribution of RPAH measured in different circular apertures for the same sample of H II regions related to the value of RPAH measured at the local peaks of Hα brightness within the H II region. Panel b demonstrate how such ratios change for different Hα luminosity bins. The different colors correspond to different outer radii of the circular aperture.
Current usage metrics show cumulative count of Article Views (full-text article views including HTML views, PDF and ePub downloads, according to the available data) and Abstracts Views on Vision4Press platform.
Data correspond to usage on the plateform after 2015. The current usage metrics is available 48-96 hours after online publication and is updated daily on week days.
Initial download of the metrics may take a while.