Fig. 9.
Download original image
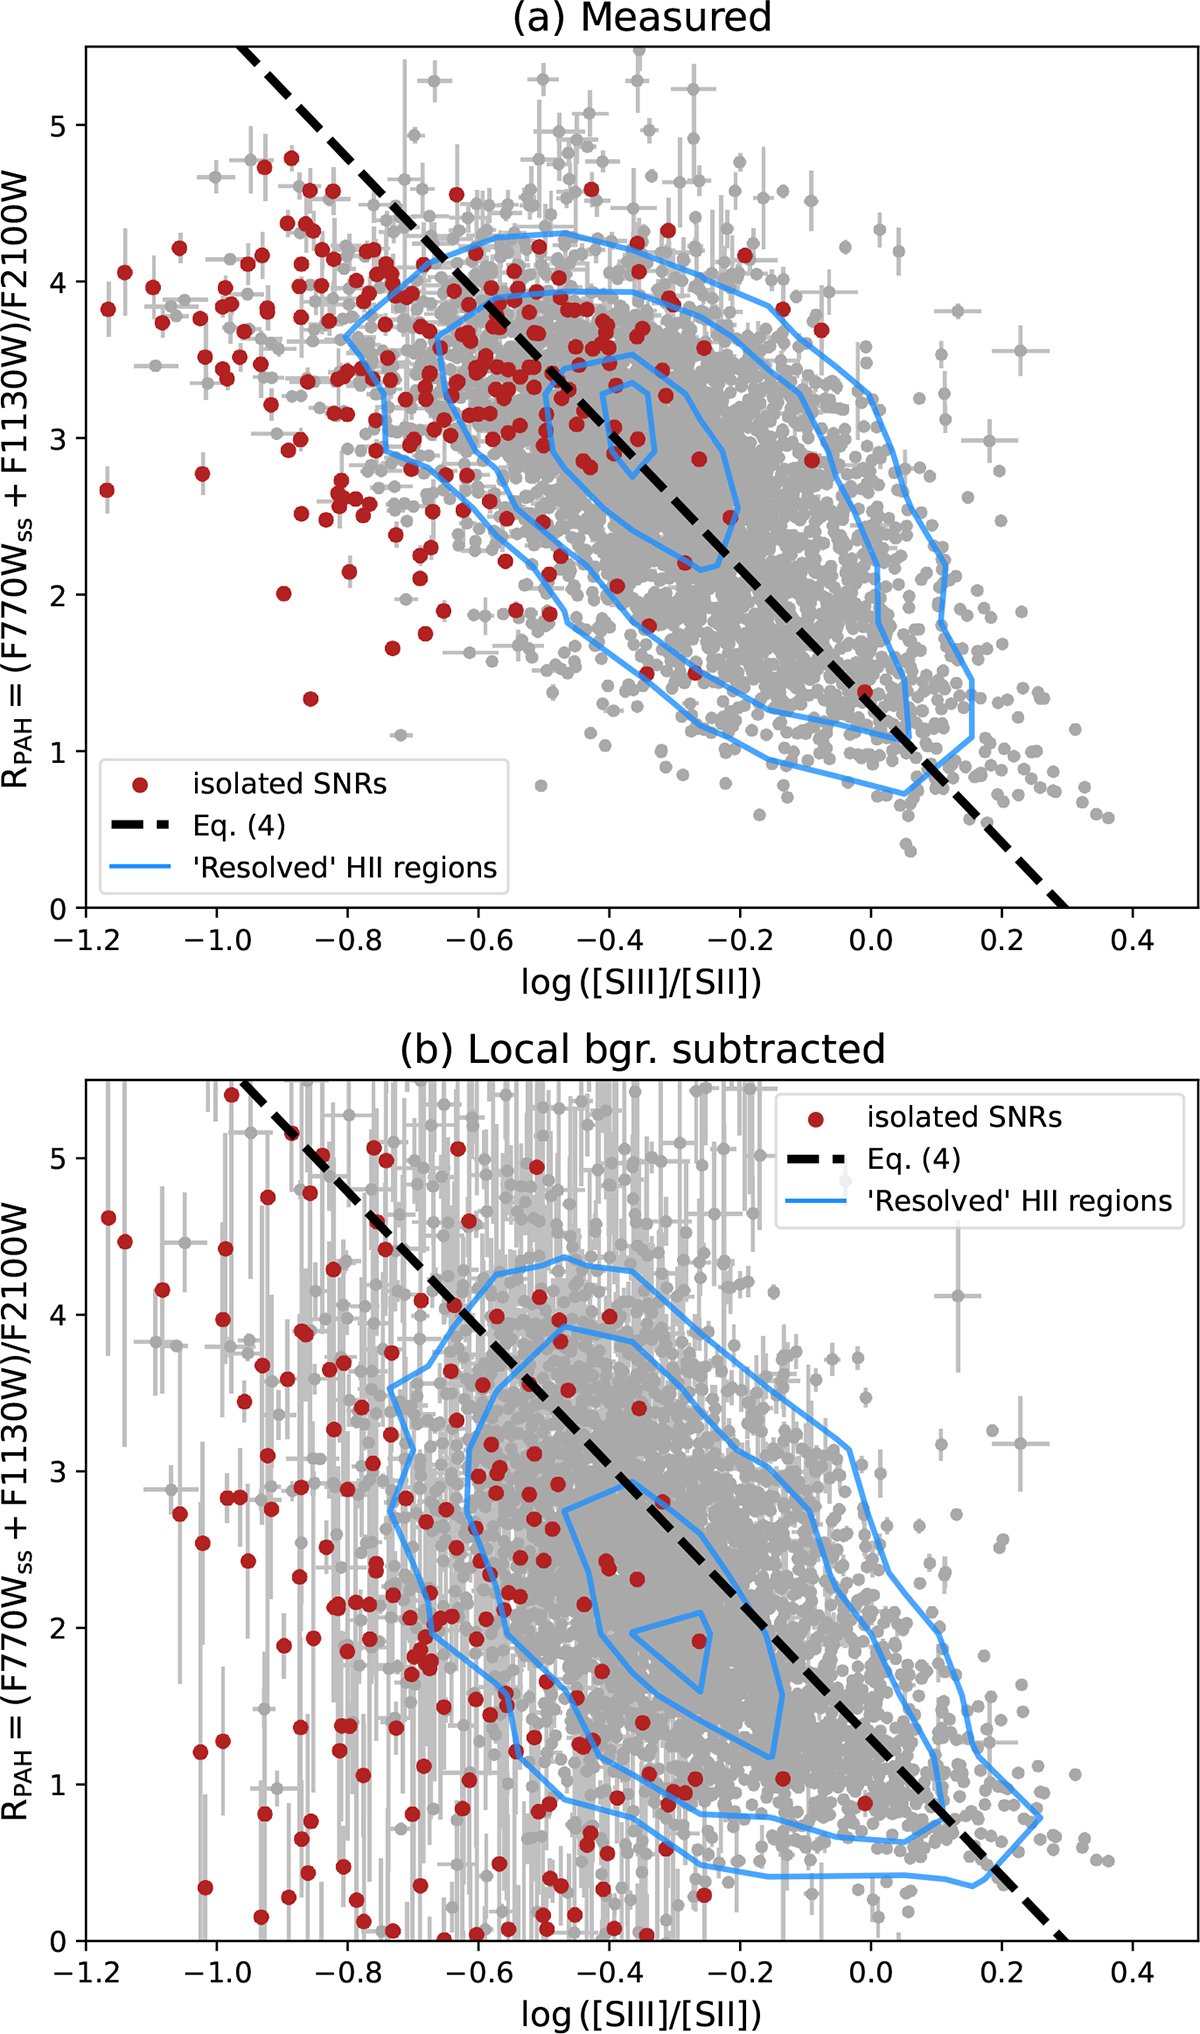
Distribution of RPAH vs. log([SIII]/[SII]) for the resolved H II regions (gray points; as in Fig. 5c) and isolated SNRs (red points). Panels (a) and (b) correspond to RPAH measurements from the observed and the local background subtracted fluxes. The black dashed line corresponds to the relation defined by Eq. (4). The cyan contours show the probability density distribution for H II regions; the levels correspond to 65, 80, 95, and 99 percentile intervals.
Current usage metrics show cumulative count of Article Views (full-text article views including HTML views, PDF and ePub downloads, according to the available data) and Abstracts Views on Vision4Press platform.
Data correspond to usage on the plateform after 2015. The current usage metrics is available 48-96 hours after online publication and is updated daily on week days.
Initial download of the metrics may take a while.