Fig. 11
Download original image
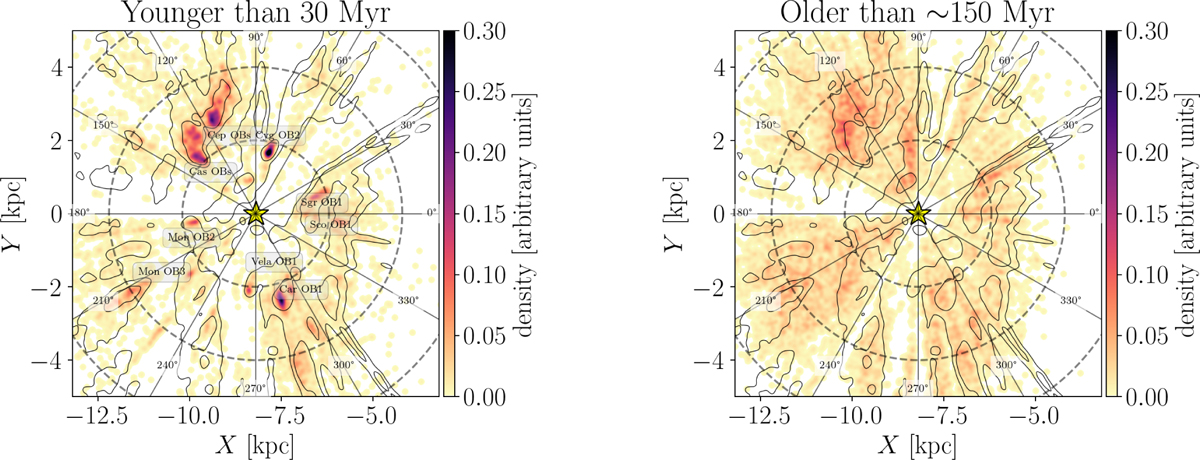
Density distribution of young (<30 Myr; left) and older (>150 Myr) sources. In the left panel, star forming regions are indicated. The solid contour lines represent the density distribution of all sources (Fig. 10, left) and are computed as described in Sect. 4. The labels highlight some of the more prominent OB associations (their locations are from Table 1 of Wright 2020). The solid lines indicate constant Galactic longitudes.
Current usage metrics show cumulative count of Article Views (full-text article views including HTML views, PDF and ePub downloads, according to the available data) and Abstracts Views on Vision4Press platform.
Data correspond to usage on the plateform after 2015. The current usage metrics is available 48-96 hours after online publication and is updated daily on week days.
Initial download of the metrics may take a while.