Fig. 12
Download original image
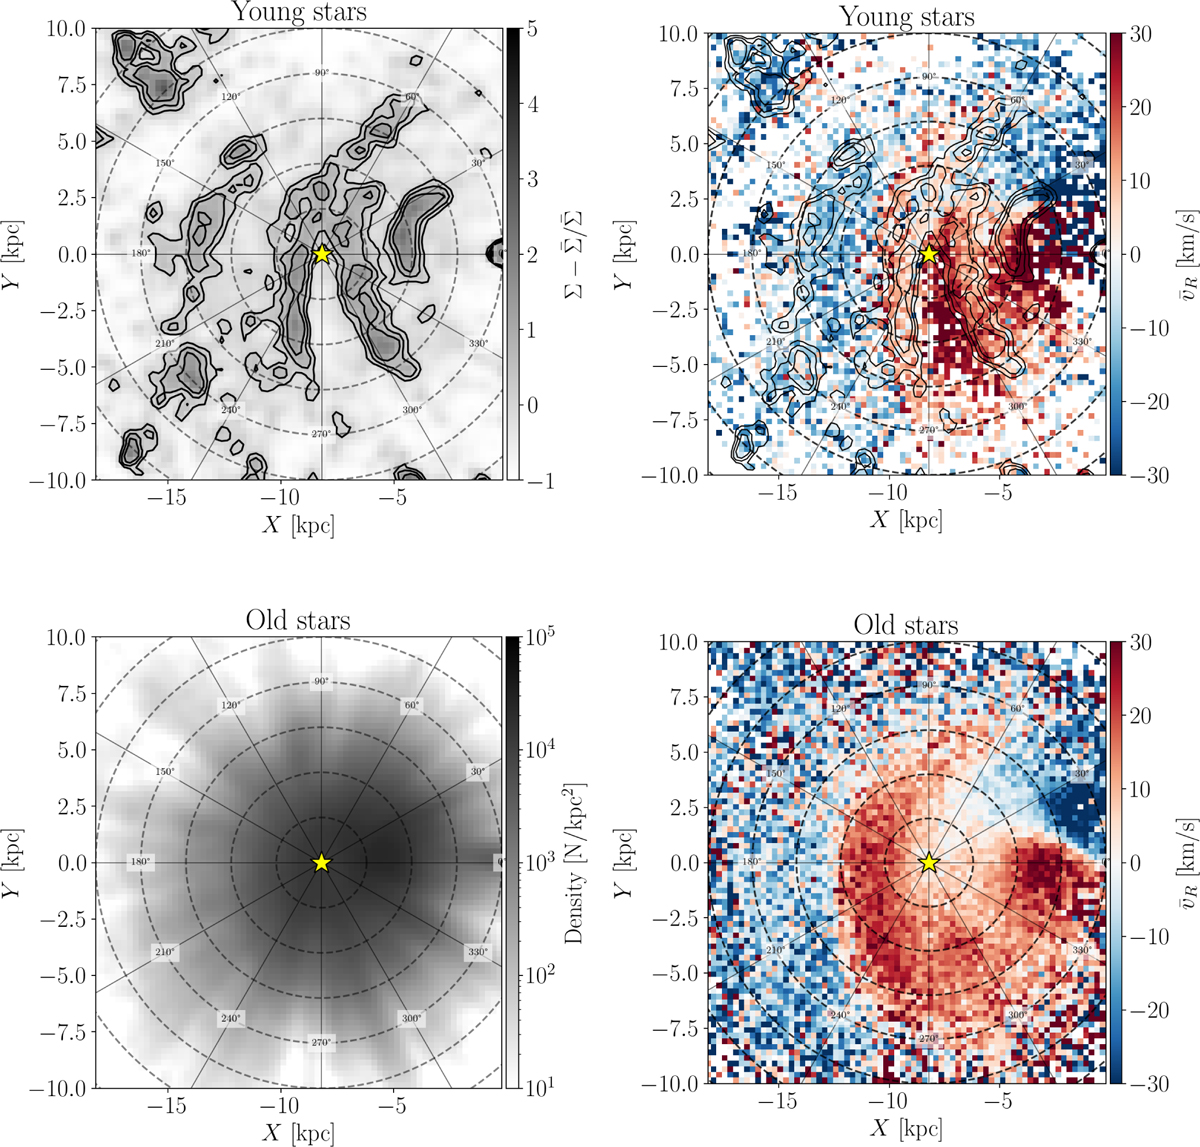
Density distribution (left) and galactocentric radial velocities (right) of the gaiauriga mock stellar catalogue for young (top) and old (bottom) sources. The black lines outline the contours of the density distribution. The black dot indicates the Galactic centre, the yellow star the Sun’s position. The dashed black lines mark concentric circles at ΔR = 2 kpc. The v̄R> feature for R ≲ 5 kpc in the right panels is due to the effect of the bar on the kinematics of sources in the inner galaxy. The solid lines indicate constant Galactic longitudes.
Current usage metrics show cumulative count of Article Views (full-text article views including HTML views, PDF and ePub downloads, according to the available data) and Abstracts Views on Vision4Press platform.
Data correspond to usage on the plateform after 2015. The current usage metrics is available 48-96 hours after online publication and is updated daily on week days.
Initial download of the metrics may take a while.