Fig. A.2
Download original image
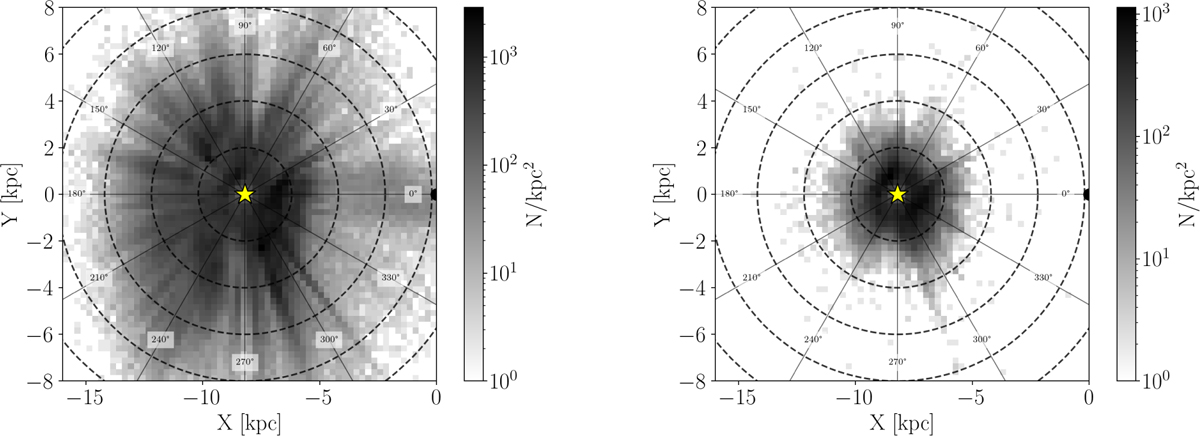
Distribution of the sample presented in D23 in the Galactic plane. The top panel shows the entire sample, the bottom panel shows only the sources with Gaia DR3 line-of-sight velocities. The yellow star represents the Sun’s position. The dashed black circles have radii R= 2, 4, 6, 8, 10 kpc. The solid lines indicate constant Galactic longitudes.
Current usage metrics show cumulative count of Article Views (full-text article views including HTML views, PDF and ePub downloads, according to the available data) and Abstracts Views on Vision4Press platform.
Data correspond to usage on the plateform after 2015. The current usage metrics is available 48-96 hours after online publication and is updated daily on week days.
Initial download of the metrics may take a while.