Fig. C.1
Download original image
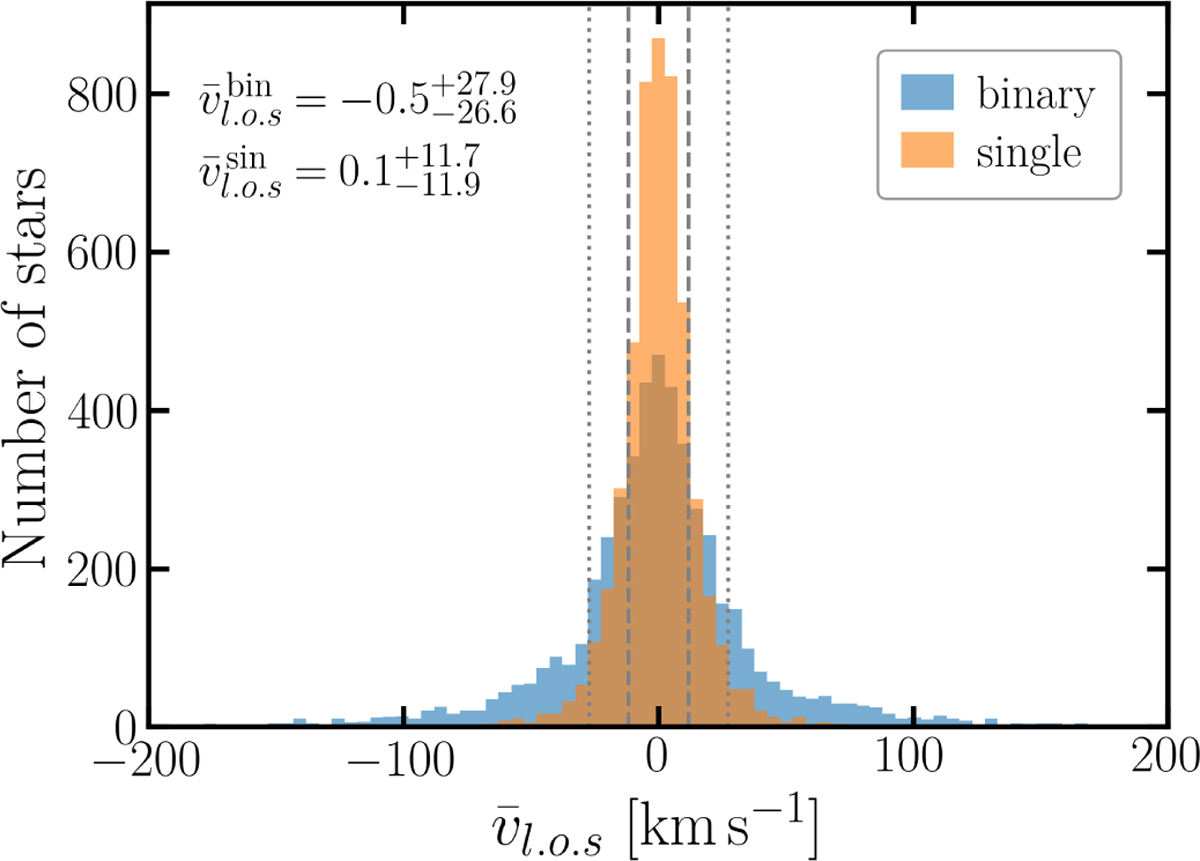
Distribution of average line-of-sight velocities for a simulated population of stars with 50% binary fraction, observed with the same cadence as our sample of Hot Stars, and with the same vl.o.s. errors. Vertical lines mark the 16th/84th percentile for single (dashed) and binary (dotted) stars. Annotated labels report the mean and corresponding uncertainty intervals derived from the 16th and 84th percentiles.
Current usage metrics show cumulative count of Article Views (full-text article views including HTML views, PDF and ePub downloads, according to the available data) and Abstracts Views on Vision4Press platform.
Data correspond to usage on the plateform after 2015. The current usage metrics is available 48-96 hours after online publication and is updated daily on week days.
Initial download of the metrics may take a while.