Open Access
Fig. 6
Download original image
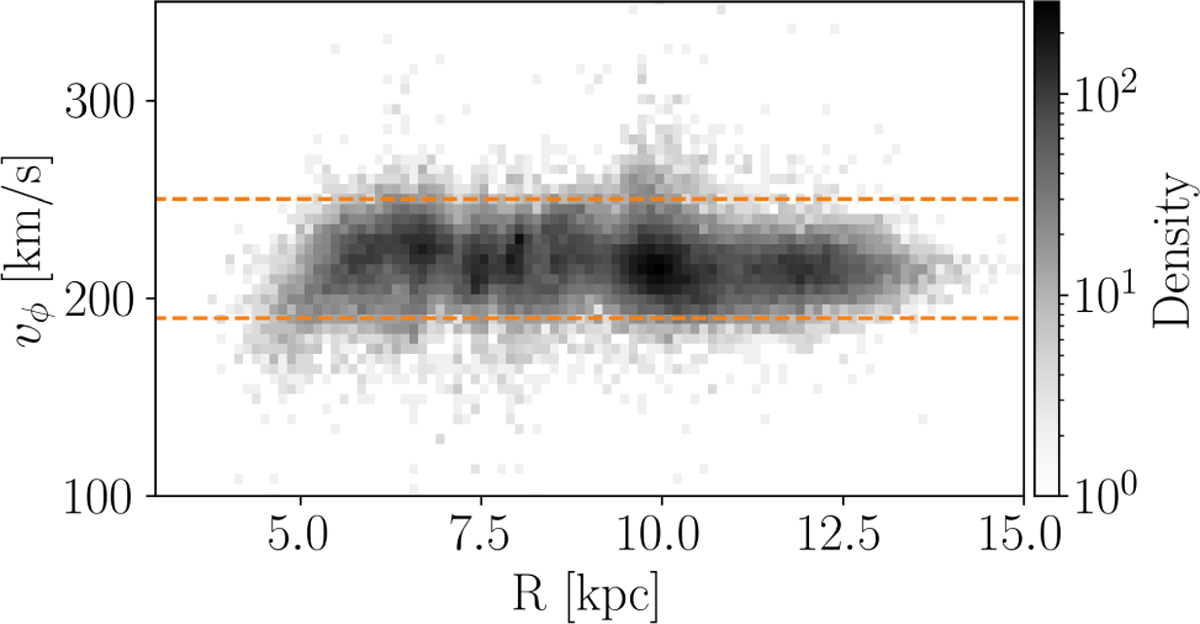
Azimuthal velocity vφ as function of galactocentric radius, R. The histogram shows the azimuthal velocity distribution. The dashed orange lines indicate the boundaries of our selection: between 190 and 250 km/s.
Current usage metrics show cumulative count of Article Views (full-text article views including HTML views, PDF and ePub downloads, according to the available data) and Abstracts Views on Vision4Press platform.
Data correspond to usage on the plateform after 2015. The current usage metrics is available 48-96 hours after online publication and is updated daily on week days.
Initial download of the metrics may take a while.