Fig. 2.
Download original image
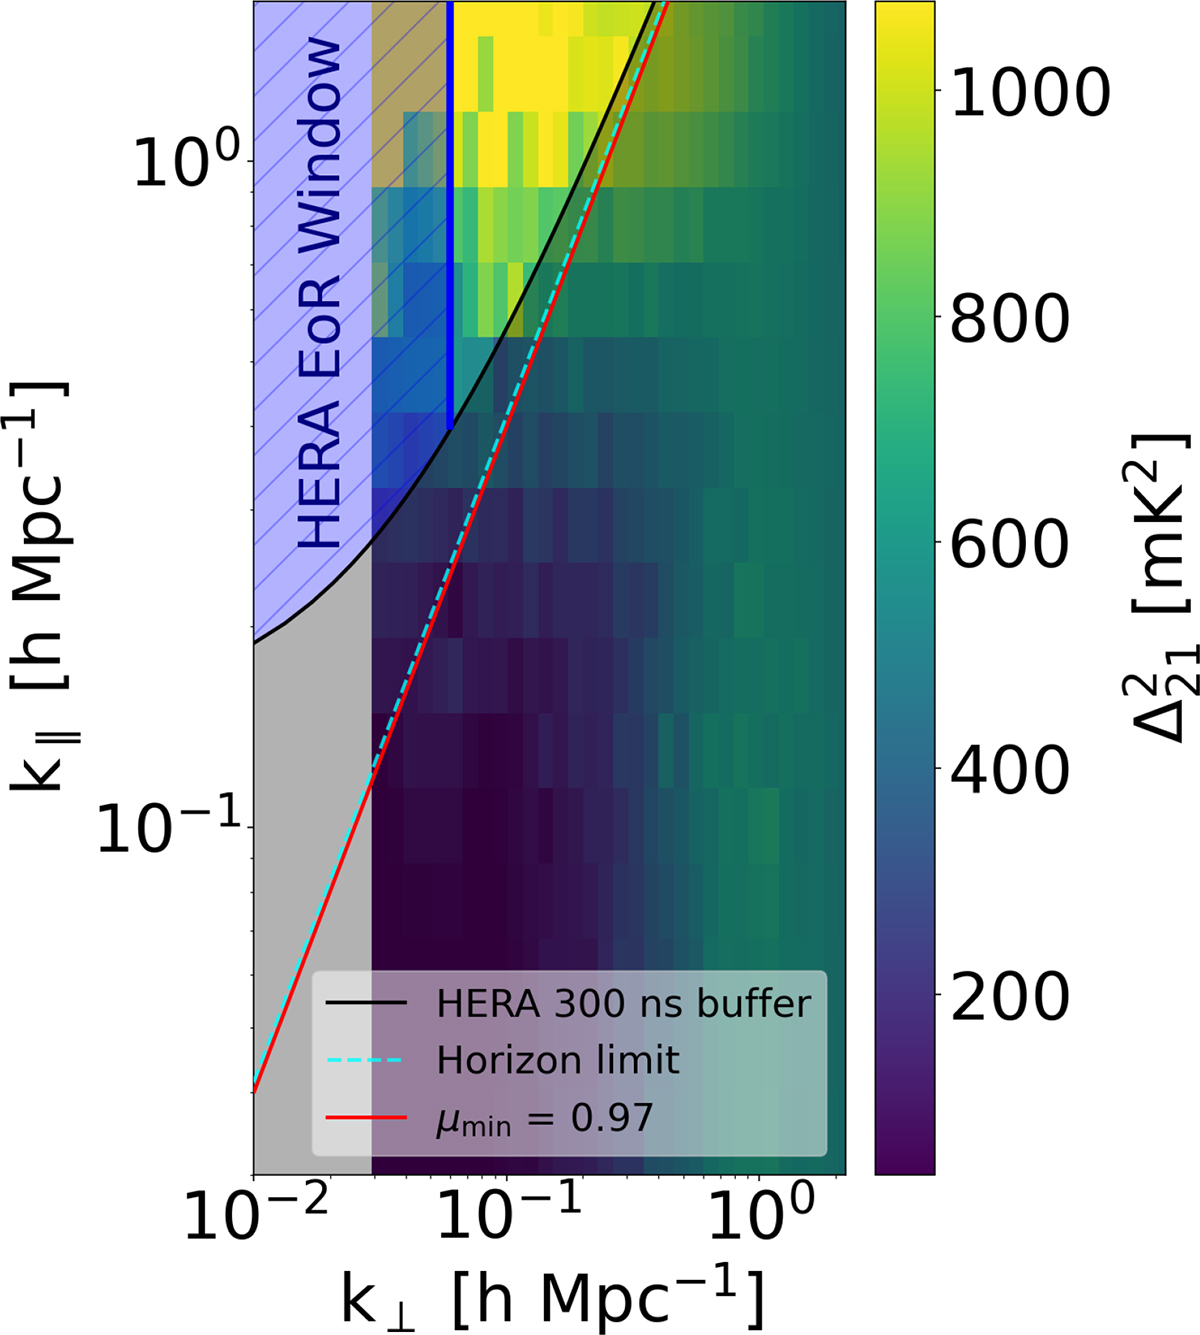
Cylindrically averaged (2D) 21 cm PS as a function of line-of-sight modes k∥ and sky-plane modes k⊥. The colour map shows the PS amplitude calculated from a slice through a single simulated light cone centred at z = 9. The simulation box has a side length of 300 cmpc and was generated with 21cmFASTv3. The blue hashed area is the HERA EoR window. The dashed cyan line is the horizon limit and the solid black line is the horizon limit with a 300 ns buffer added to it to account for additional foreground leakage (see HERA Collaboration 2023). The solid red line is drawn at a value of μmin = 0.97, where μmin = cos θ, and ![]() . In this paper, we use the red line as a rough approximation for the solid black line.
. In this paper, we use the red line as a rough approximation for the solid black line.
Current usage metrics show cumulative count of Article Views (full-text article views including HTML views, PDF and ePub downloads, according to the available data) and Abstracts Views on Vision4Press platform.
Data correspond to usage on the plateform after 2015. The current usage metrics is available 48-96 hours after online publication and is updated daily on week days.
Initial download of the metrics may take a while.