Fig. 4.
Download original image
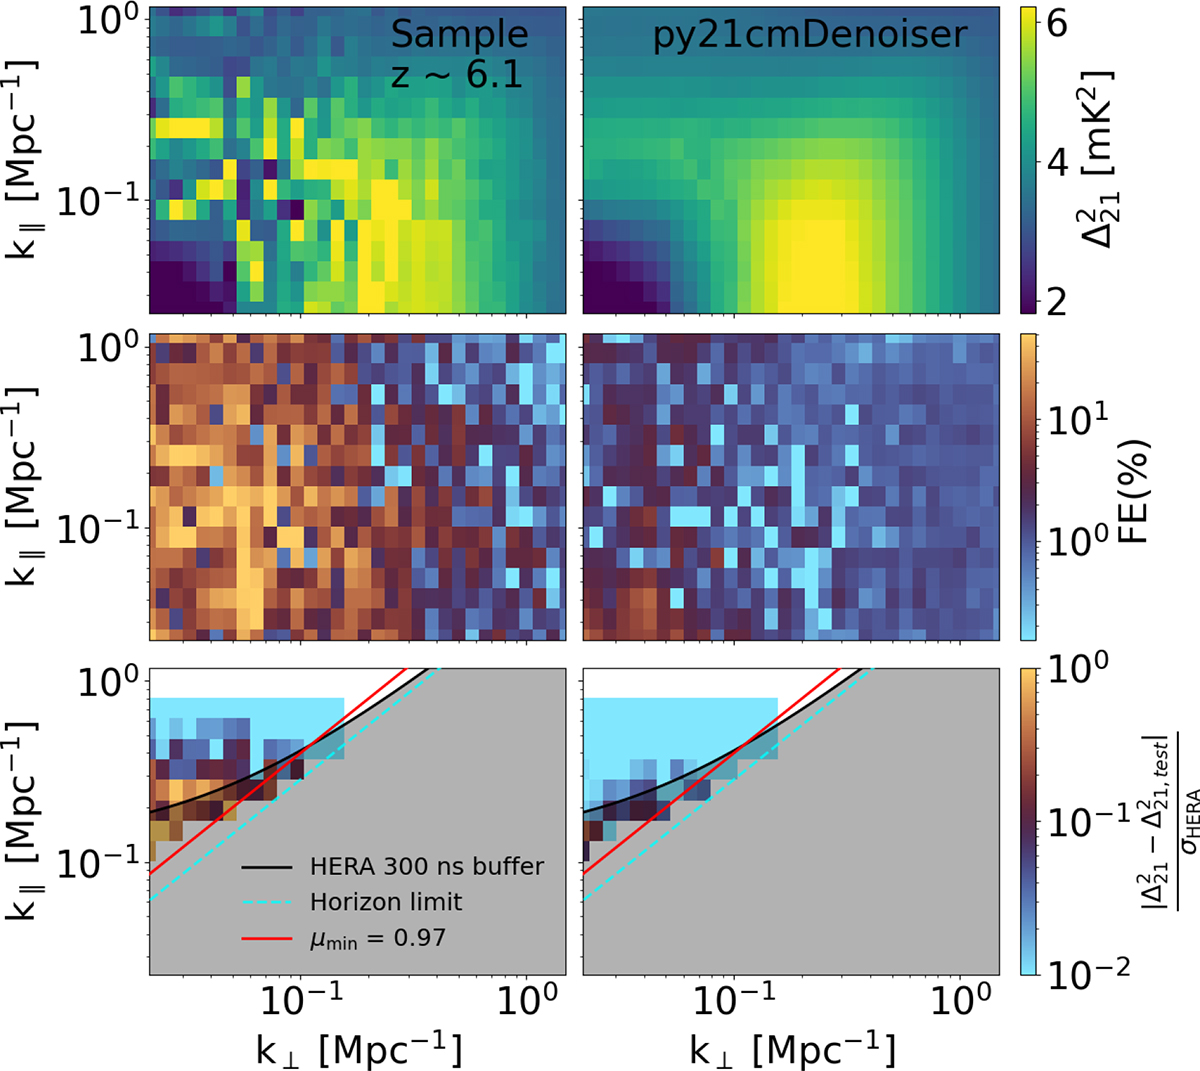
Top row: PS sample (left) and NN mean estimate from this same PS sample as input (right). Middle row: FE with respect to the mean PS obtained from an ensemble average of about 200 PS realisations for the sample (left) and 21cmPSDenoiser (right). Bottom row: error as a fraction of the HERA noise level at the same redshift for the sample (left) and for the 21cmPSDenoiser (right).
Current usage metrics show cumulative count of Article Views (full-text article views including HTML views, PDF and ePub downloads, according to the available data) and Abstracts Views on Vision4Press platform.
Data correspond to usage on the plateform after 2015. The current usage metrics is available 48-96 hours after online publication and is updated daily on week days.
Initial download of the metrics may take a while.