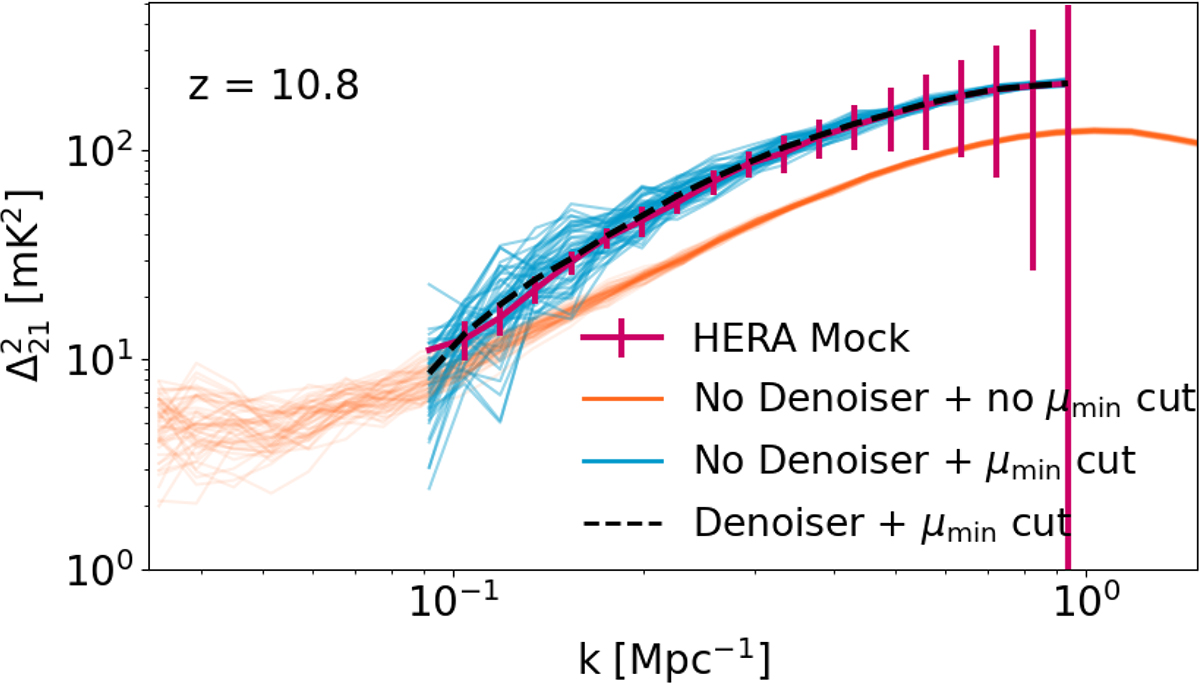
Fig. 9.
Download original image
Spherically averaged 21 cm PSs at z = 10.8 corresponding to a parameter vector in our test set, θmock. Pink points and error bars correspond to a mock ∼2256 h observation with HERA (see text for details). In orange, we plot different realisations, varying ICs at a fixed θmock, but spherically averaging the 2D PS down to μmin = 0, as is commonly done when forward-modelling. In blue, we plot these realisations but instead averaging only down to μmin = 0.97 to account for the HERA footprint in cylindrical space (see red line in Figure 2). Excising low μ modes removes the bias seen in the orange curves, but dramatically increases the sample variance. The dashed black line corresponds to the output of 21cmPSDenoiser from a single 2D PS realisation, averaged down to μmin = 0.97. We see that applying 21cmPSDenoiser mitigates both the bias and the sample variance.
Current usage metrics show cumulative count of Article Views (full-text article views including HTML views, PDF and ePub downloads, according to the available data) and Abstracts Views on Vision4Press platform.
Data correspond to usage on the plateform after 2015. The current usage metrics is available 48-96 hours after online publication and is updated daily on week days.
Initial download of the metrics may take a while.