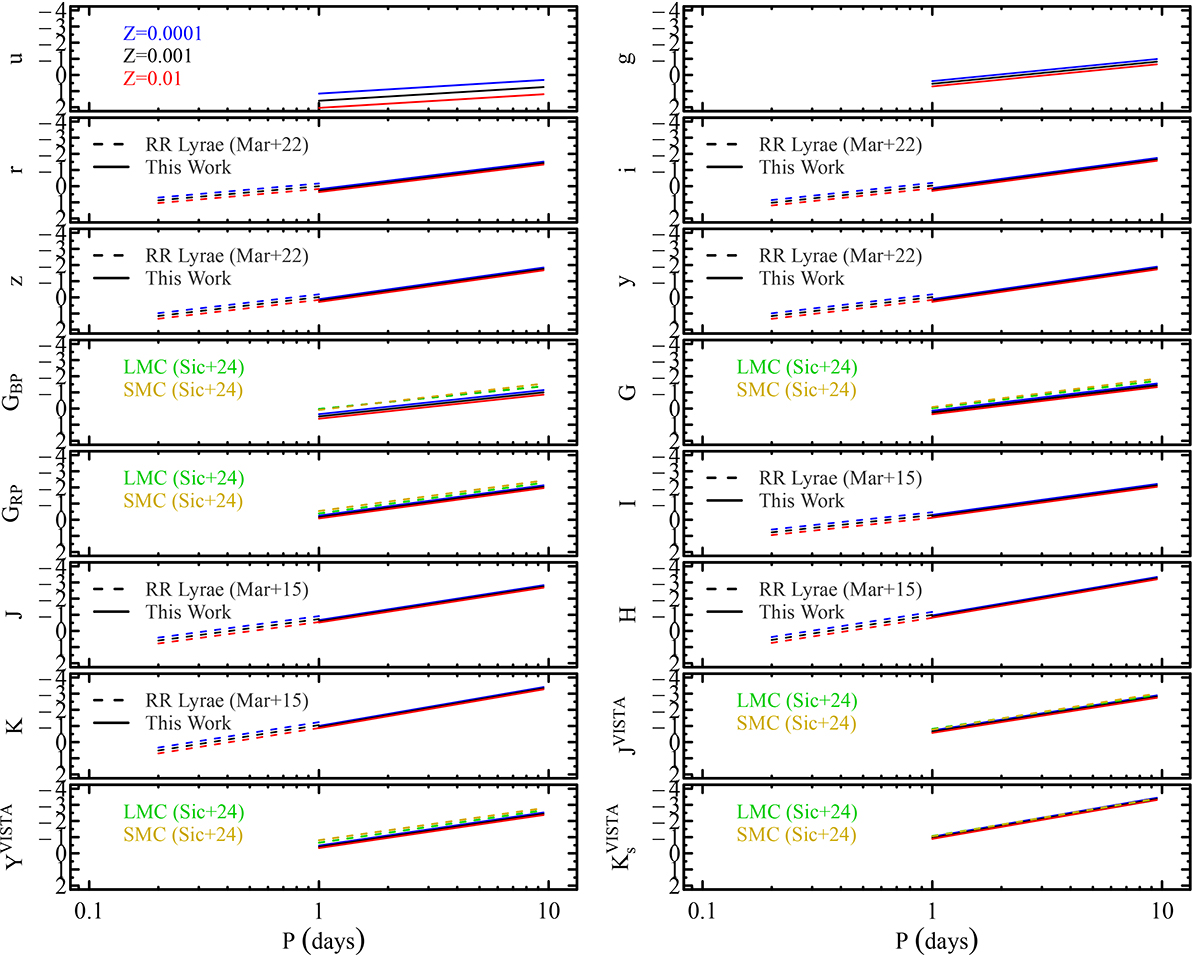
Fig. 1.
Download original image
PL relations obtained for several bands. In order, from top to bottom and left to right, we show the Gaia GBP, G, and GRP bands; Johnson-Cousins I, J, H, and K bands; VISTA J, Y, and Ks bands; and the Rubin-LSST g, r, i, z, and y bands. Different colours reflect the three different metallicities. The dashed lines correspond to the relations from RRL models (Marconi et al. 2015, 2022), while the relations from Sicignano et al. (2024) for the Gaia and VISTA bands are plotted in green and yellow.
Current usage metrics show cumulative count of Article Views (full-text article views including HTML views, PDF and ePub downloads, according to the available data) and Abstracts Views on Vision4Press platform.
Data correspond to usage on the plateform after 2015. The current usage metrics is available 48-96 hours after online publication and is updated daily on week days.
Initial download of the metrics may take a while.