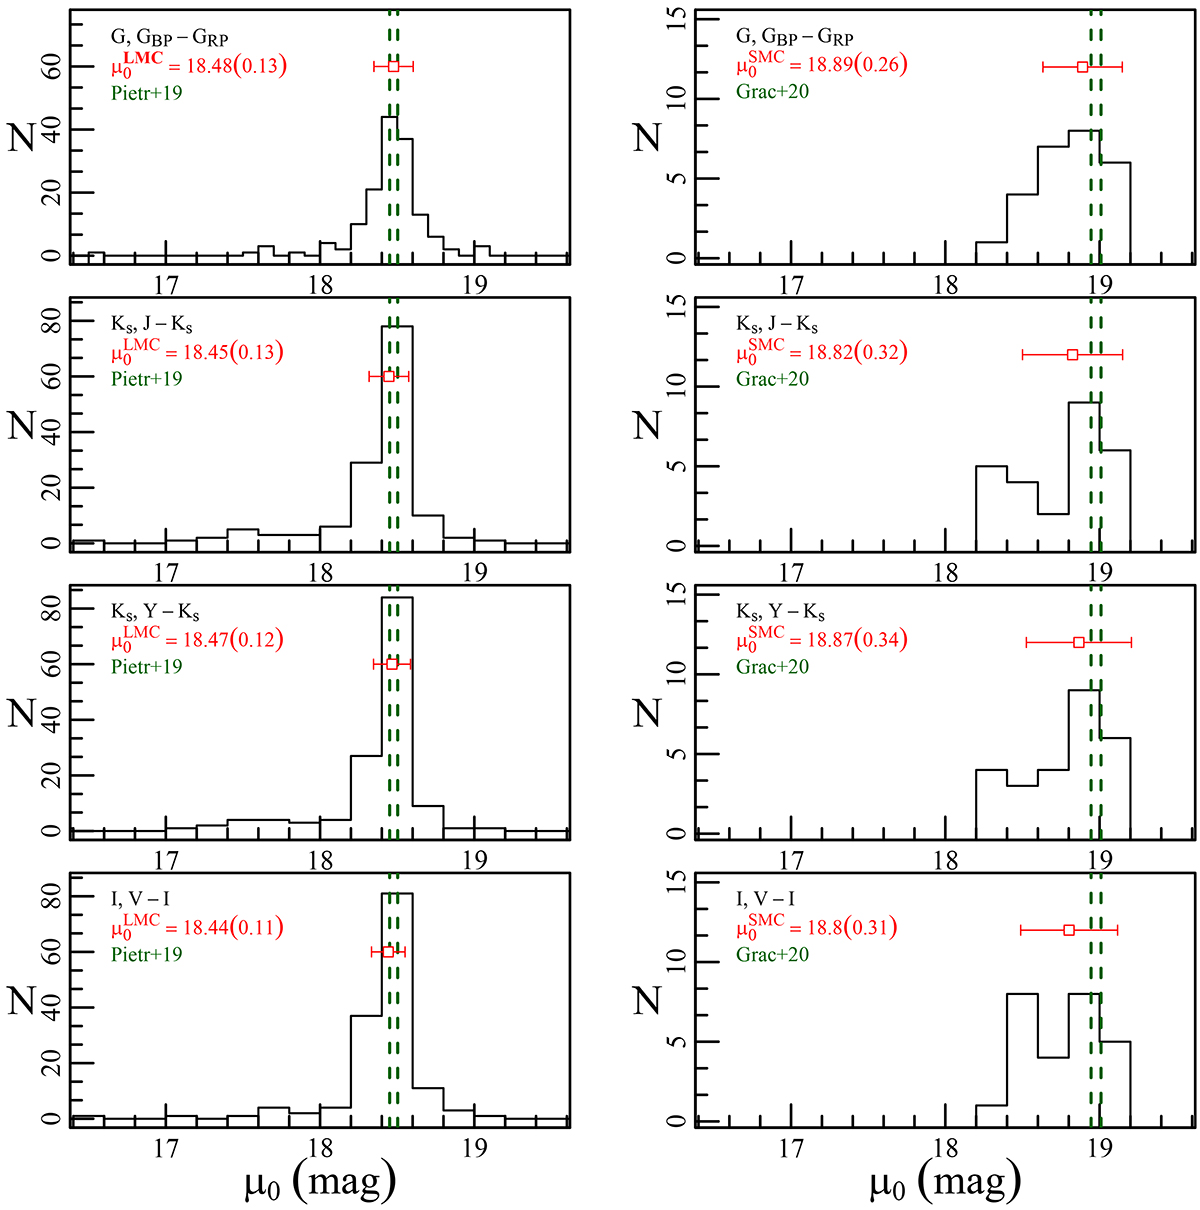
Fig. 3.
Download original image
Distributions of μ0 values obtained by applying our PWZ theoretical relations to a sample of LMC T2Cs (left panels) and SMC T2Cs (right panels). The results for different bands are plotted in different panels. From top to bottom: Gaia G, BP − RP, VISTA Ks, J − Ks, VISTA Ks, Y − Ks, and Johnson I, V − I PWZ relations. The vertical green lines represent the LMC and SMC distance ranges around the currently adopted geometric best values from Pietrzyński et al. (2019) and Graczyk et al. (2020), respectively, while the red square and the error bar indicate the median value of our distribution and its robust standard deviation (i.e. 1.4826 ⋅ MAD), respectively.
Current usage metrics show cumulative count of Article Views (full-text article views including HTML views, PDF and ePub downloads, according to the available data) and Abstracts Views on Vision4Press platform.
Data correspond to usage on the plateform after 2015. The current usage metrics is available 48-96 hours after online publication and is updated daily on week days.
Initial download of the metrics may take a while.