Fig. 1
Download original image
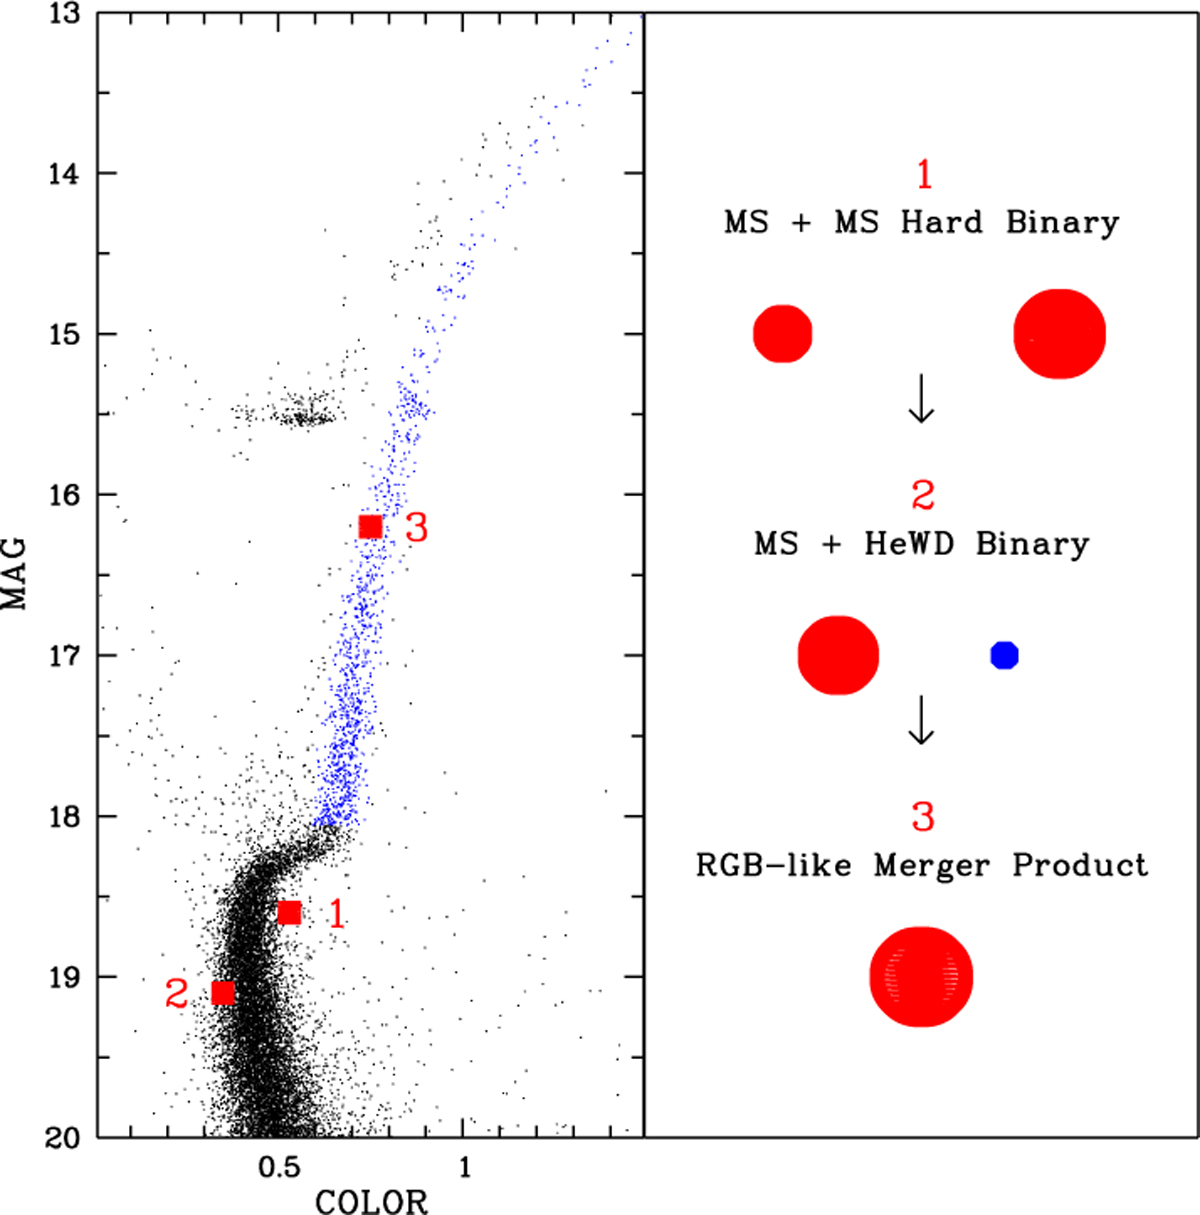
Left panel: optical colour-magnitude diagram (CMD), F555W versus (F439W-F555W), of the globular cluster NGC 362 based on HST photometry from Piotto et al. (2002). Three filled red squares show the expected consecutive locations of an initial MS binary in its evolution towards and RGB-like merger remnant, schematically illustrated in the right panel. Blue points show stars along the RGB, covering its entire range from the base upwards. Right panel: schematic illustration of the main consecutive stages in the evolution of a hard binary initially composed of two MS stars (1), then transformed into a (MSS+HeWD) binary (2), which finally merges to form an RGB-like merger product (3) evolving along the cluster RGB.
Current usage metrics show cumulative count of Article Views (full-text article views including HTML views, PDF and ePub downloads, according to the available data) and Abstracts Views on Vision4Press platform.
Data correspond to usage on the plateform after 2015. The current usage metrics is available 48-96 hours after online publication and is updated daily on week days.
Initial download of the metrics may take a while.