Fig. 1
Download original image
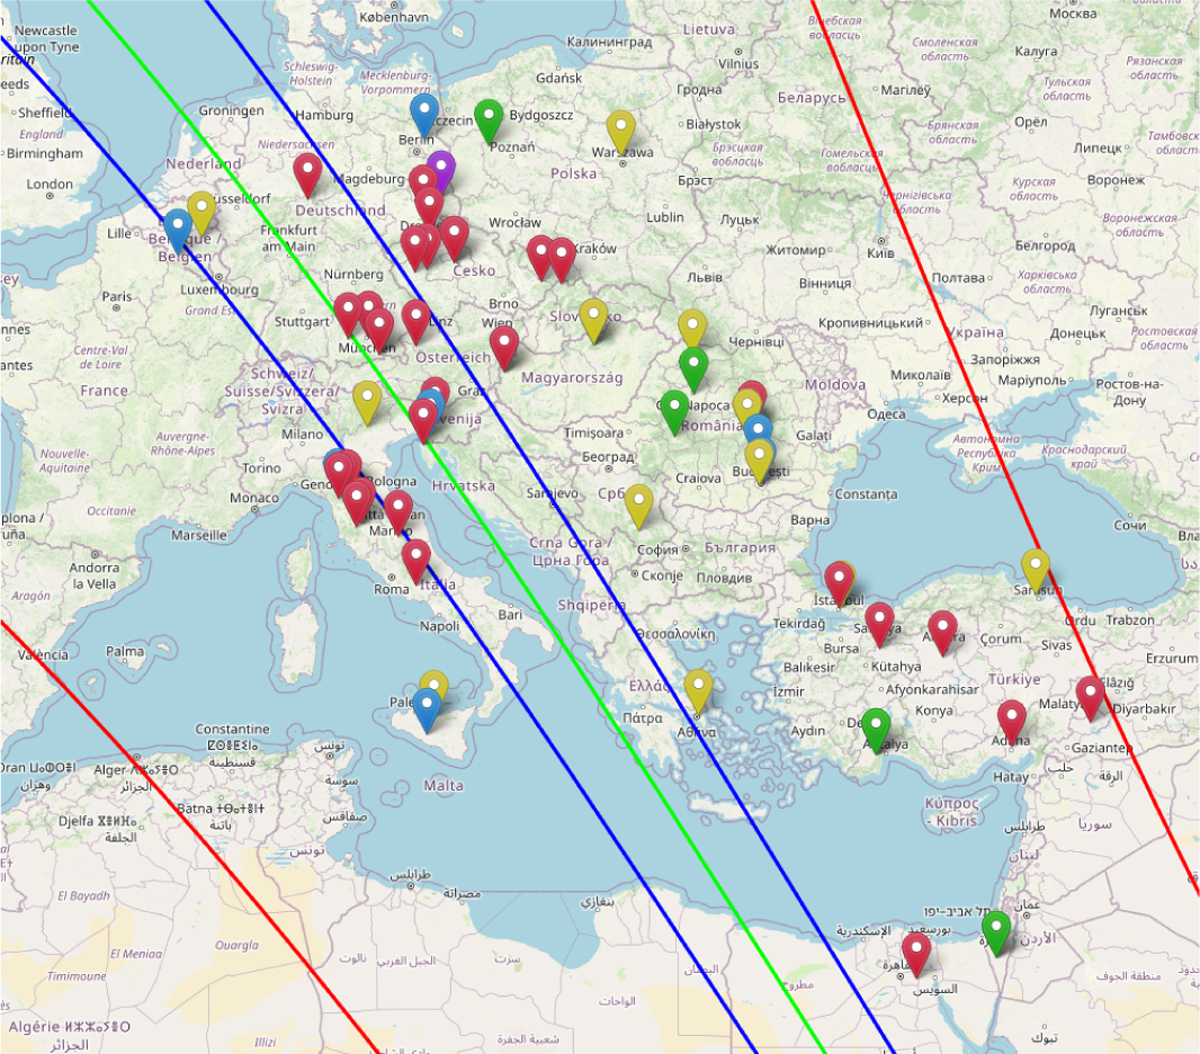
Map of the ground track from our refined prediction, which incorporated astrometry acquired at the 1.5 m Sierra Nevada telescope, the 1.2 m Calar Alto telescope, and the 2 m Liverpool telescope. The blue lines mark the boundaries of the body’s shadow, calculated assuming a spherical shape with a diameter (D) of 398 km. The central path is indicated by a green line. Red lines illustrate the 3-sigma uncertainties associated with the prediction. The map also shows the observation sites: green markers denote positive detections, red negative detections (i.e., “misses”), blue planned but unexecuted observations, yellow locations with adverse weather, and purple technical problems. Map credit: OpenStreetMap.
Current usage metrics show cumulative count of Article Views (full-text article views including HTML views, PDF and ePub downloads, according to the available data) and Abstracts Views on Vision4Press platform.
Data correspond to usage on the plateform after 2015. The current usage metrics is available 48-96 hours after online publication and is updated daily on week days.
Initial download of the metrics may take a while.