Fig. 2
Download original image
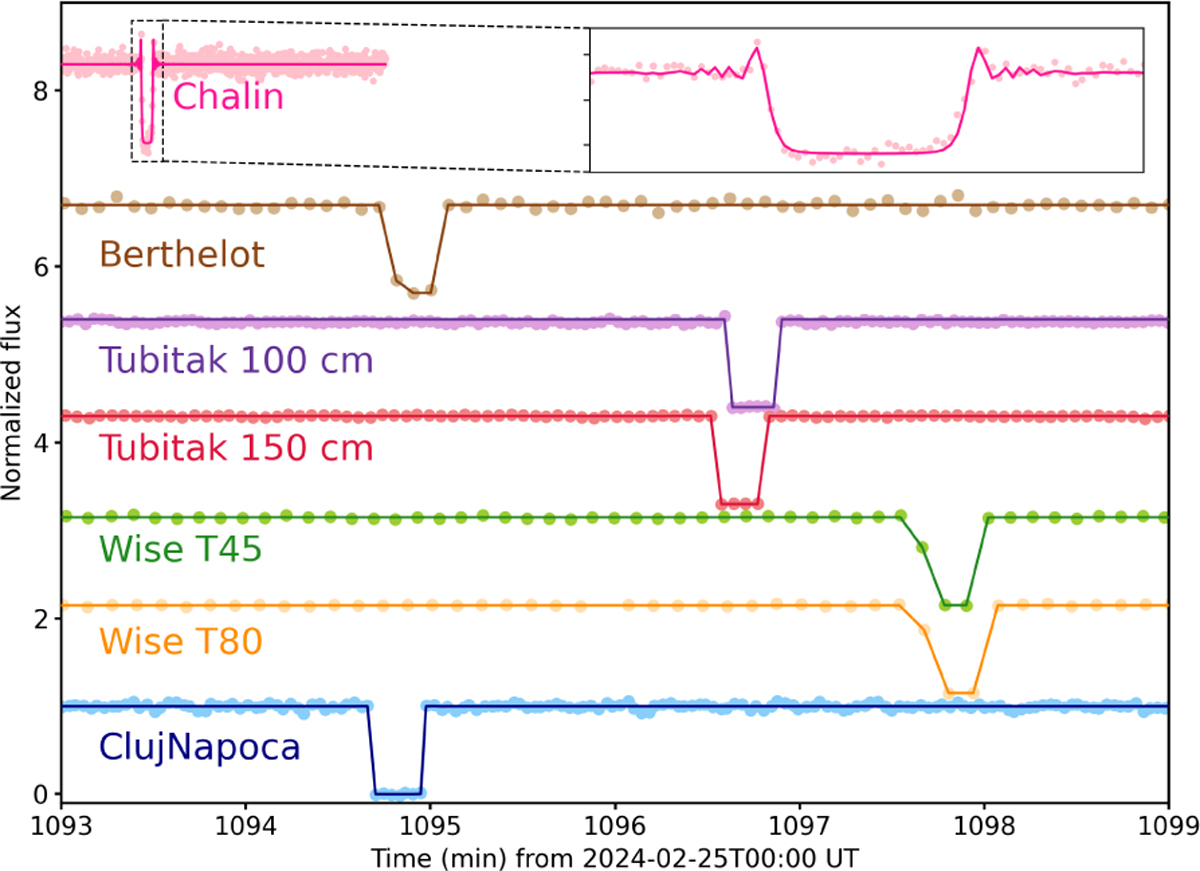
Occultation light curves from the various instruments that successfully registered the event. The light curves (flux versus time) are normalized to one, with an arbitrary offset applied for enhanced clarity. Dots represent the observational data, while the lines correspond to the model as described in Sect. 2. The Chalin light curve (pink) is enlarged the inset.
Current usage metrics show cumulative count of Article Views (full-text article views including HTML views, PDF and ePub downloads, according to the available data) and Abstracts Views on Vision4Press platform.
Data correspond to usage on the plateform after 2015. The current usage metrics is available 48-96 hours after online publication and is updated daily on week days.
Initial download of the metrics may take a while.