Open Access
Fig. 4
Download original image
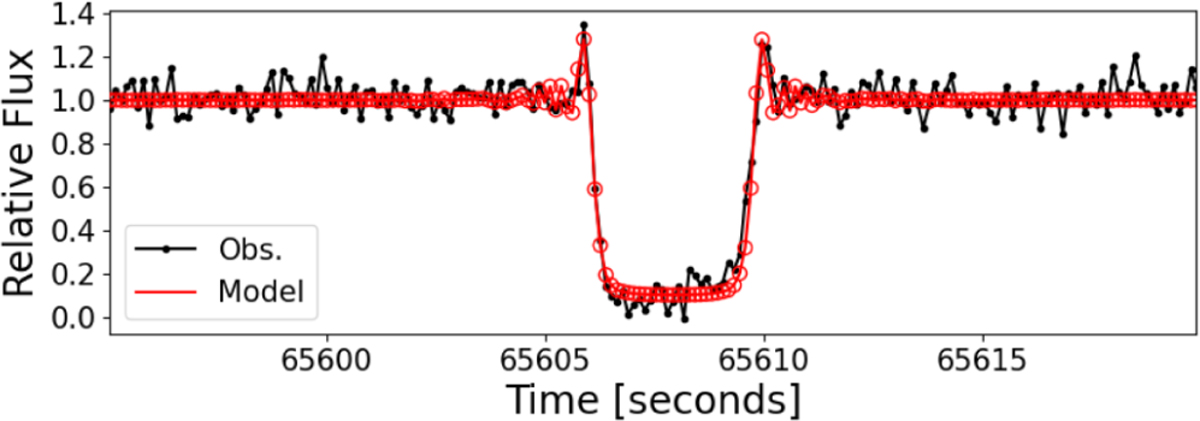
Grazing light curve at Chalin (black dots) together with a model fit (red line) as described in the text. The light curve (flux versus time) clearly shows diffraction spikes at both disappearance and reappearance.
Current usage metrics show cumulative count of Article Views (full-text article views including HTML views, PDF and ePub downloads, according to the available data) and Abstracts Views on Vision4Press platform.
Data correspond to usage on the plateform after 2015. The current usage metrics is available 48-96 hours after online publication and is updated daily on week days.
Initial download of the metrics may take a while.