Fig. 5
Download original image
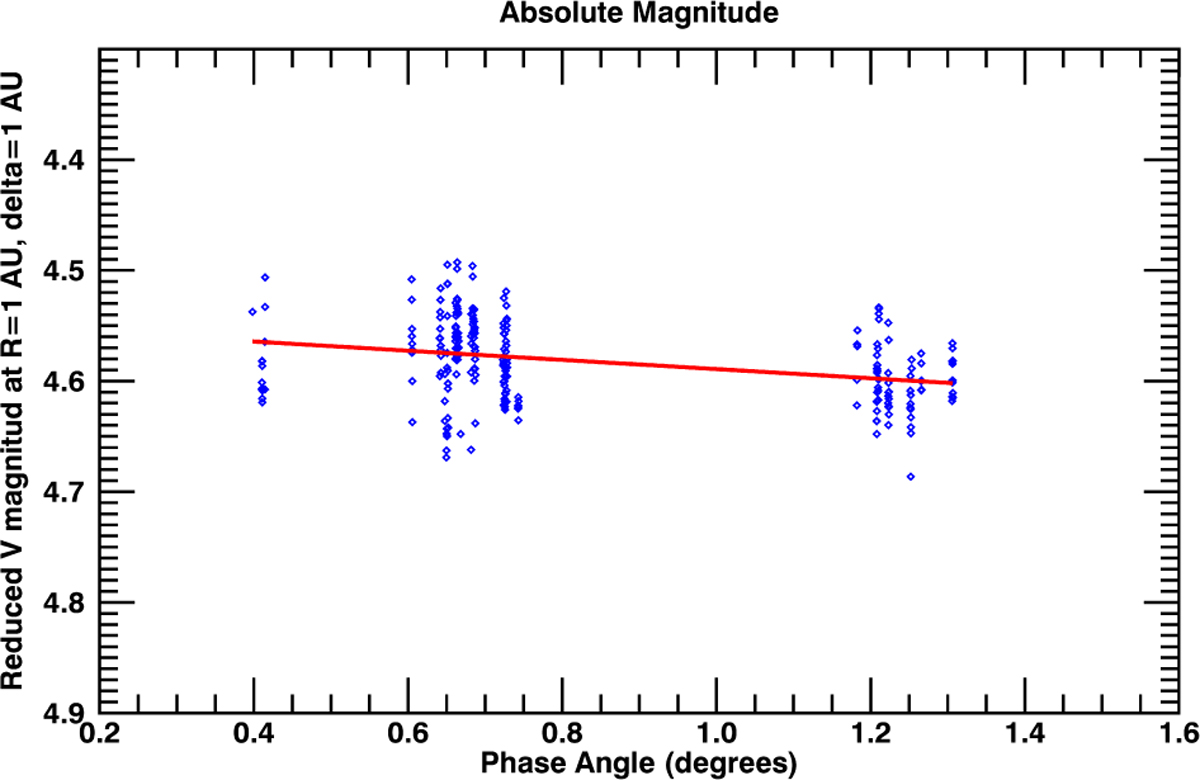
Reduced magnitude, mV (1, 1, α), plotted against the phase angle, α. A total of 649 observations, obtained with the 2 m Liverpool telescope, the 1.5 m telescope at Sierra Nevada Observatory, and the 1.2 m telescope at Calar Alto Observatory, were analyzed. This plot was constructed after applying a sigma-clip rejection for outliers and selecting images with a signal-to-noise ratio greater than 30.
Current usage metrics show cumulative count of Article Views (full-text article views including HTML views, PDF and ePub downloads, according to the available data) and Abstracts Views on Vision4Press platform.
Data correspond to usage on the plateform after 2015. The current usage metrics is available 48-96 hours after online publication and is updated daily on week days.
Initial download of the metrics may take a while.