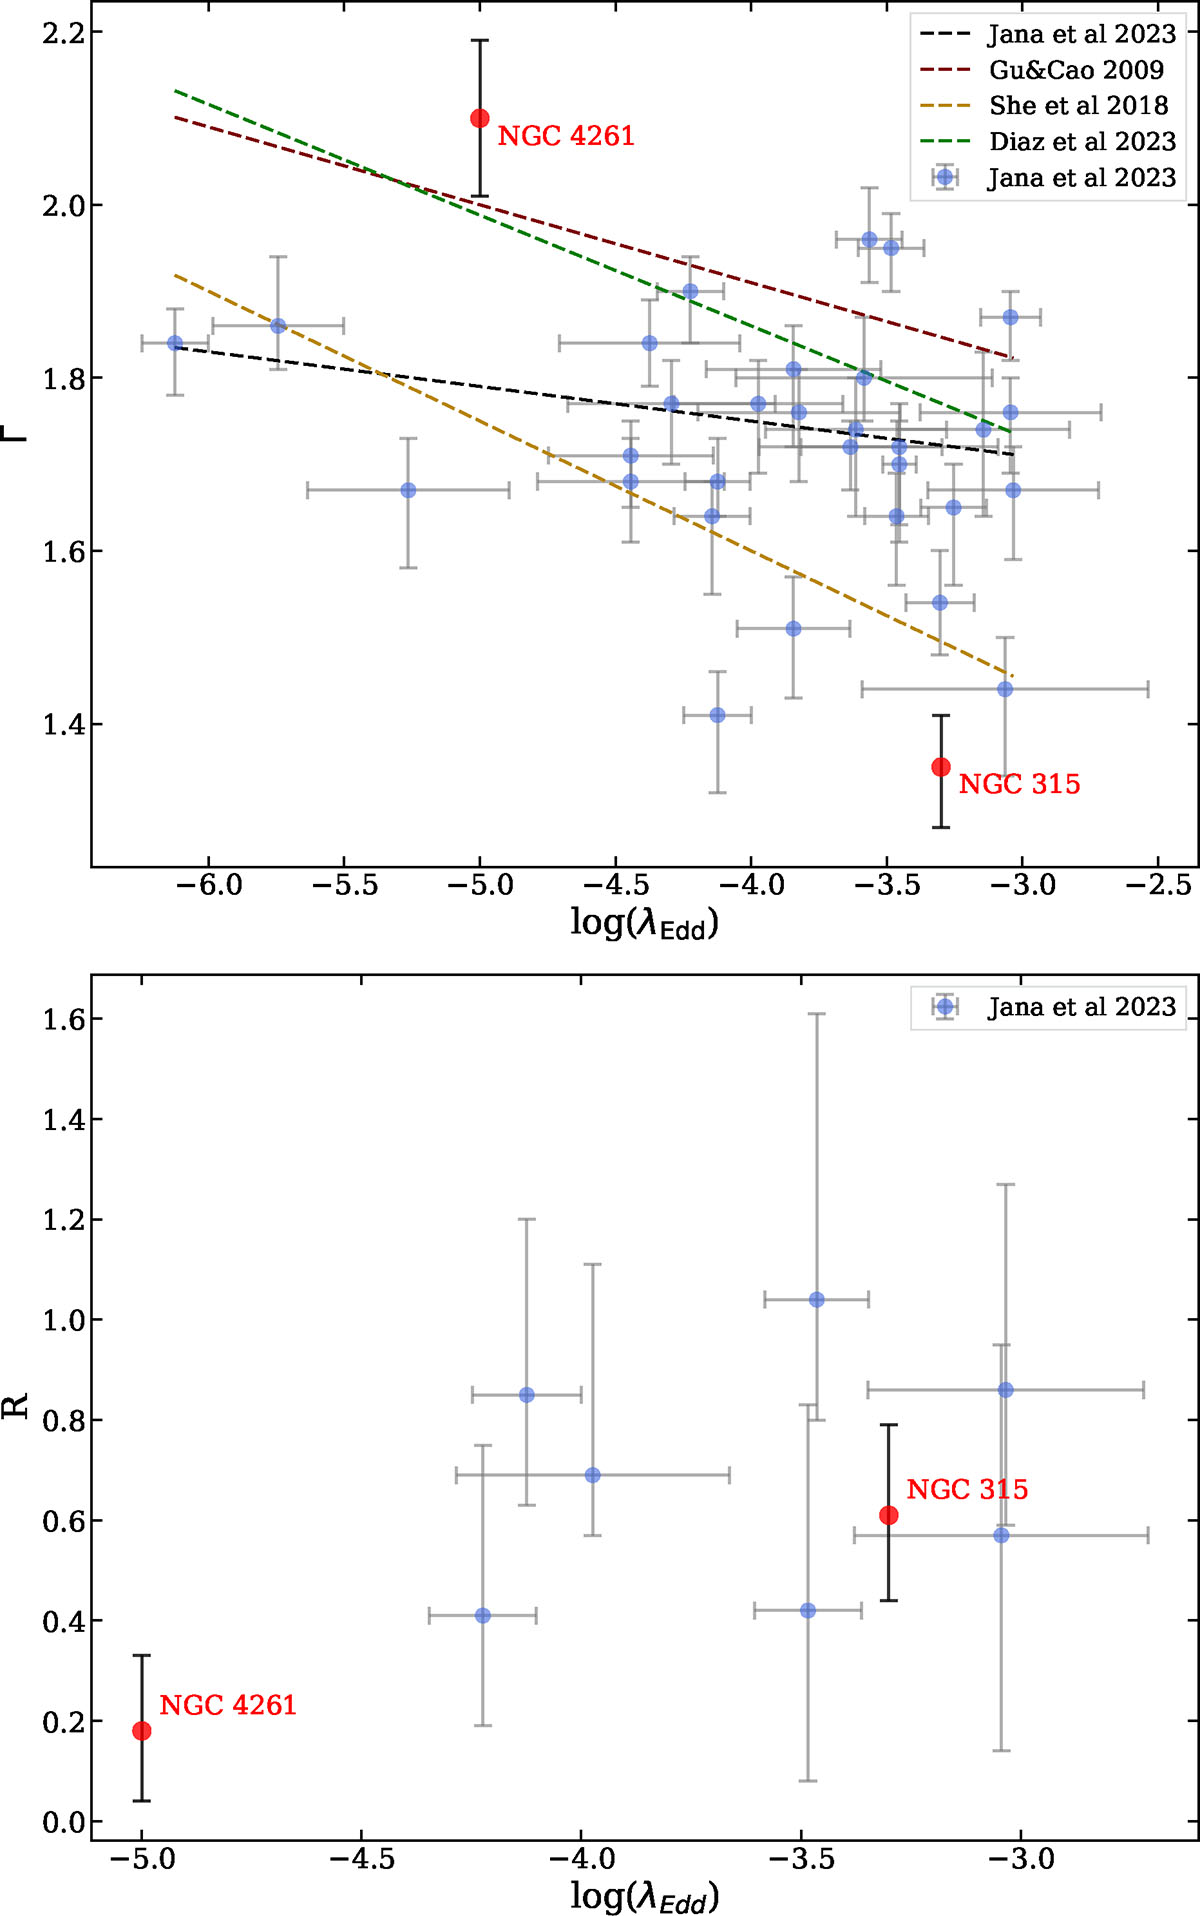
Fig. 6.
Download original image
Photon spectral index (Γ; top panel) and reflection fraction (R; bottom panel) as a function of Eddington ratio (λEdd). The red dots denote NGC 315 and NGC 4261. The blue dots and the dashed black line correspond to the results obtained from Jana et al. (2023). The dashed maroon, dark yellow, and green lines in the bottom panel correspond to the fitting lines for their samples from Gu & Cao (2009), She et al. (2018), and Diaz et al. (2023), respectively.
Current usage metrics show cumulative count of Article Views (full-text article views including HTML views, PDF and ePub downloads, according to the available data) and Abstracts Views on Vision4Press platform.
Data correspond to usage on the plateform after 2015. The current usage metrics is available 48-96 hours after online publication and is updated daily on week days.
Initial download of the metrics may take a while.