| Issue |
A&A
Volume 703, November 2025
|
|
|---|---|---|
| Article Number | A272 | |
| Number of page(s) | 11 | |
| Section | Astrophysical processes | |
| DOI | https://doi.org/10.1051/0004-6361/202556509 | |
| Published online | 19 November 2025 | |
Hard X-ray view of two γ-ray-detected low-luminosity active galactic nuclei: NGC 315 and NGC 4261
School of Physics, Beijing Institute of Technology, Beijing 100081, China
⋆ Corresponding author: This email address is being protected from spambots. You need JavaScript enabled to view it.
Received:
19
July
2025
Accepted:
3
October
2025
Abstract
Aims. The accretion disk of low-luminosity active galactic nuclei (LLAGNs) is a radiatively inefficient accretion flow (RIAF). Our goal is to find evidence of RIAF radiation from LLAGNs with jets and analyze their radiation properties, which will provide samples that can be used in future research on LLAGNs.
Methods. We conducted an analysis of the X-ray data obtained from NuSTAR and XMM-Newton observations of NGC 315 and NGC 4261 that encompasses both timing and spectral investigations. The joint X-ray spectra of the two LLAGNs were fitted using various functional forms and radiative models in XSPEC.
Results. No significant variability on timescales of days is observed for either NGC 315 or NGC 4261. The X-ray continuum emission of NGC 315 is suitable for cutoff power-law (PL) fitting. This fitting yields a cutoff energy (Ecut) of 18.45+8.00−4.51 keV, which is the lowest value found in LLAGNs so far. In contrast, the X-ray continuum of NGC 4261 is composed of two PL components, with no signs of a cutoff energy. A prominent neutral Fe Kα line is observed in NGC 315, while an ionized Fe XXV line is seen in NGC 4261. The derived reflection fractions (R) are 0.61+0.18−0.17 for NGC 315 and 0.18+0.15−0.14 for NGC 4261. Neither NGC 315 nor NGC 4261 shows evidence of a Compton reflection bump.
Conclusions. The X-ray spectral characteristics indicate RIAF emission is the dominant origin of the X-rays in both sources, although an additional soft PL component originating from the inner jet is observed in NGC 4261. The higher reflection fraction compared to other LLAGNs, along with the detection of a neutral Fe Kα line, suggests the existence of a truncated accretion disk with a relatively small radius in NGC 315. Bremsstrahlung radiation appears to be the dominant cooling mechanism for the plasma in NGC 315, while Comptonization within the RIAF is more likely responsible for the X-ray emission in NGC 4261.
Key words: accretion / accretion disks / radiation mechanisms: general / telescopes
© The Authors 2025
 Open Access article, published by EDP Sciences, under the terms of the Creative Commons Attribution License (https://creativecommons.org/licenses/by/4.0), which permits unrestricted use, distribution, and reproduction in any medium, provided the original work is properly cited.
This article is published in open access under the Subscribe to Open model. This email address is being protected from spambots. You need JavaScript enabled to view it. to support open access publication.
1. Introduction
Active galactic nuclei (AGNs) are powered by material accreted through the supermassive black holes at the center of galaxies (Rees 1984). Low-luminosity AGNs (LLAGNs) are defined by their low bolometric luminosities (Lbol; Gu & Cao 2009), which typically range from 1038 to 1042 erg s−1, as well as their extremely low Eddington ratios (λEdd = Lbol/LEdd < 10−3, where LEdd denotes the Eddington luminosity; Ho et al. 1995; Flohic et al. 2006; Ho 2008). These characteristics are generally attributed to insufficient gas supply in the vicinity of the central black hole (Ho et al. 1997).
Compared to those of luminous AGNs (LAGNs), the broadband spectral energy distributions (SEDs) of LLAGNs in the ultraviolet band do not exhibit a prominent “big blue bump”, a characteristic feature of standard optically thick, geometrically thin accretion disks (Ho 1999; Eracleous et al. 2010). In the X-ray band, most LLAGNs show no variability on timescales of days (Binder et al. 2009; Younes et al. 2011, 2019) and generally lack significant reflection components, such as the hard X-ray Compton bump (e.g., Younes et al. 2019) and broad Fe emission lines (Terashima et al. 2002; Hernández-García et al. 2013). Moreover, LLAGNs deviate from several correlations established for typical AGNs. For example, for LAGNs the photon spectral index (Γ) and λEdd are positively correlated, whereas they are negatively corrected for LLAGNs (Sobolewska & Papadakis 2009; Gu & Cao 2009; Jana et al. 2023). These differences suggest that LLAGNs host central engines distinct from those of LAGNs.
The radiatively inefficient accretion flow (RIAF) model offers a plausible explanation for the low luminosities and observed characteristics of LLAGNs (Narayan et al. 1998). Among RIAF models, the advection-dominated accretion flow (ADAF) is the most extensively studied. It is characterized by a low density, a low optical depth, and radiative inefficiency, leading to a geometrically thick and optically thin accretion structure (Narayan & Yi 1994; Yuan 2007; Yuan & Narayan 2014). There is a prominent red bump and double-peaked Balmer emission lines in the mid-infrared spectrum of some LLAGNs, suggesting the presence of an optically thick, externally truncated disk (Chen & Halpern 1989; Storchi-Bergmann et al. 2003). Theoretical analyses and numerical simulations have shown that ADAFs are prone to jet formation and the generation of strong outflows, which is consistent with the observational evidence that LLAGNs are frequently radio-loud (Narayan & Yi 1994; Nagar et al. 2000; Yuan & Narayan 2014).
Most Fanaro-Riley I (FR I) radio galaxies have been shown to have RIAF (Wu et al. 2007), and their radiation is considered to be dominated by the jet mode (see Heckman & Best 2014; O’Dea & Saikia 2021). A significant correlation has been observed between the X-ray luminosity of the nuclear region and the radio/optical luminosities in certain FR I radio galaxies (Donato et al. 2004; Evans et al. 2006), which implies the X-ray emission originates in a jet. However, the physical connection between these two luminosities does not necessarily mean a common jet origin, and the origin of X-rays from the RIAF cannot be ruled out (Gliozzi et al. 2003; Donato et al. 2004). In particular, the presence of a cutoff energy and Fe emission lines suggests an X-ray origin from the disk corona1 (Gliozzi et al. 2003; Fukazawa et al. 2015; Wong et al. 2024). Hard X-rays can reveal the transition between synchrotron and inverse Compton emission processes in jets, as well as provide information regarding the high-energy cutoff in the disk-corona system. Therefore, the observation and analysis of hard X-ray spectra is essential for determining the origin of X-ray emission and understanding the properties of the central engine in LLAGNs.
NGC 315 and NGC 4261 are two FR I radio galaxies that have been detected in γ-ray emission by the Fermi Large Area Telescope (Abdollahi et al. 2022; Ballet et al. 2023). High-resolution observations obtained through very long baseline interferometry and the Very Large Array reveal that both sources display twin-jet radio structures (Venturi et al. 1993; Cotton et al. 1999; Jones & Wehrle 1997). From an optical classification perspective, NGC 315 is a low-ionization nuclear emission region (LINER) 1.9 galaxy, while NGC 4261 is a LINER 2 galaxy (Ho et al. 1997). Both belong to the class of LLAGNs. See Table 1 for more details. In the X-ray band, using observational data from XMM-Newton, Chandra, and BeppoSAX, Gliozzi et al. (2003) reported that the nucleus spectrum of NGC 4261, extending up to 100−150 keV from 0.3−10 keV, is described well by a power-law (PL) with Γ ≃ 1.5 along with a highly ionized unresolved iron line at ∼7 keV. They suggested that the X-ray emission from the nucleus of NGC 4261 is primarily dominated by the disk corona rather than the base of the jet. For NGC 315, the nucleus X-ray spectrum in the 0.4−4.5 keV band observed with Chandra is similarly modeled by a PL with Γ = 1.4 ± 0.4. Using observational data from XMM-Newton and Chandra, González-Martín et al. (2009) detected ionized Fe emission lines in the X-ray spectrum of NGC 315. It is important to note that the broadband SED of NGC 315 and NGC 4261 cannot be explained with a single jet model (Nemmen et al. 2014; Tomar et al. 2021; Almeida et al. 2022).
Basic properties of NGC 315 and NGC 4261.
In this paper we present NuSTAR hard X-ray observations of NGC 315 and NGC 4261. Using these observations in conjunction with XMM-Newton observational data obtained during the same flux states as the NuSTAR observations (for details, refer to Sect. 3.2.1), we conducted a comprehensive analysis of the broadband X-ray spectra of both sources to investigate their X-ray spectral characteristics and potential origins. The observational data and reduction procedures are described in Sect. 2, and the methods and results of the data analysis are presented in Sect. 3. A detailed discussion of the findings is provided in Sect. 4, and a summary of the study is given in Sect. 5.
2. Observations and data reduction
NGC 315 and NGC 4261 were observed by NuSTAR (Harrison et al. 2013) on 27 July 2021 and 2 June 2021, respectively. Each observation had an exposure time of 45 ks. We used data from two detectors (FPMA and FPMB) on NuSTAR. The data were processed using HEASoft v6.31.1 in conjunction with calibration files from CALDB version 20231205. Clean level 2 event files were generated using the nupipeline script of the NuSTAR data analysis software package, applying standard filtering criteria. Source and background regions were selected using the DS9 tool (Joye & Mandel 2003). The source data were extracted from a circular region centered on the source position with a radius of 30″, while the background was extracted from a circular region located at a sufficient distance from the source, with a radius of 60″. Spectra were extracted and ancillary/response files were generated using the nuproducts task. All spectra were binned using the grppha tool from FTOOLS to ensure a minimum of 25 counts per bin, thereby enabling the application of χ2 statistics.
To more accurately constrain and investigate the energy spectral properties of the two sources, we retrieved their earlier high-quality X-ray observations from XMM-Newton (Jansen et al. 2001). Specifically, an observation conducted on 27 January 2019 with an exposure time of 51 ks for NGC 315 and another carried out on 16 December 2007 with an exposure time of 127 ks for NGC 4261. Compared to other available data, these observations take into account the observation quality and the time interval between their respective NuSTAR observations. The data acquired from the three X-ray EPIC cameras were utilized, including one EPIC-pn camera (Strüder et al. 2001) and two EPIC-MOS cameras (Turner et al. 2001). Data processing was performed using the Science Analysis System (SAS; v21.0.0). The event list, filtered to include only good X-ray events (“FLAG= = 0”), effectively excluded high background flare activity and was subsequently employed to generate scientific products for the pn and MOS cameras, utilizing single-event selections. Events with pn mode 0−4 and MOS mode 0−12 were exclusively selected. Source and background regions were defined in a manner consistent with that used for NuSTAR. No pile-up effects were detected for either of the two sources. Response matrix files were generated using the SAS task rmfgen, while ancillary response files were created using arfgen. Spectra were binned to ensure a signal-to-noise ratio (S/N) of at least 3 per spectral bin and a minimum of 25 counts per bin, thereby facilitating model parameter estimation and error calculation via χ2 statistics in XSPEC.
3. Data analysis and results
For NGC 315 and NGC 4261, the X-ray jet sizes resolved by Chandra are approximately 10″ (Worrall et al. 2003) and 20″ (Zezas et al. 2005), respectively. These values are comparable to the 18″ full width at half maximum of the NuSTAR point spread function (Worrall et al. 2007). Consequently, the Chandra-resolved core and jet regions cannot be distinguished in NuSTAR observations. Additionally, while some point sources near the core region of NGC 4261 were detected by Chandra, their contributions can be neglected in the analysis (Gliozzi et al. 2003). The spectral analysis of the NuSTAR and XMM-Newton data was conducted using XSPEC version 12.13.0c (Arnaud 1996). Given that the signals from both sources became indistinguishable from their respective backgrounds above 30 keV, the spectral fitting for these sources was performed within the 3−30 keV range for NuSTAR and the 0.5−10 keV range for XMM-Newton. To account for potential calibration uncertainties among detectors on the same satellite, a multiplicative constant normalization factor was introduced. In this approach, the normalization factor for one detector was fixed at unity, while the other was allowed to vary freely. This strategy was also applied to address any calibration discrepancies between NuSTAR and XMM-Newton. Unless otherwise specified, all errors quoted throughout this manuscript correspond to the 1σ confidence level.
3.1. Timing analysis
We generated background-corrected light curves using the observational data with a time bin of 1 ks, as shown in Fig. 1. The energy range for the NuSTAR data is 3−30 keV, while that for XMM-Newton is 0.5−10 keV. To evaluate the variability, we calculated the square root of the normalized excess variance (σNXS2) and its error [err(σNXS2)], following the definition provided by Vaughan et al. (2003),
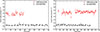 |
Fig. 1. XMM-Newton/pn and Nustar/FPMA background-corrected light curves with a time bin of 1 ks for NGC 315 (left panel) and NGC 4261 (right panel), corresponding to the energy ranges of 0.5−10 KeV and 3−30 keV, respectively. In each case, time zero corresponds to the start time of the observation by the respective satellite. |
 (1)
(1)
 (2)
(2)
 (3)
(3)
where x and σerr are the count rate and its corresponding error, N is the number of the data points in the light curves, and S2 is the variance of the light curves.
When σNXS2 is less than or equal to zero within the errors, the data fluctuation is smaller than the expected statistical fluctuation, indicating no variability (Imazawa et al. 2021). During the selected observation period, no significant variability is detected. We calculated the 3σ upper limits caused by Poisson fluctuations, which are listed in Table 3. This finding suggests that neither of the two sources exhibits significant X-ray flux variation over short timescales, a result consistent with previous studies (Hernández-García et al. 2014) and in contrast to the pronounced short-timescale variability observed in the bright Seyfert galaxy (e.g., González-Martín & Vaughan 2012). It is worth noting that the XMM-Newton observation data obtained on 16 December 2001 showed the short-term variations of NGC 4261. Both the inner jet and accretion flow may account for such variability (Sambruna et al. 2003; Gliozzi et al. 2003).
3.2. Spectral analysis
3.2.1. Feasibility analysis of joint spectral fitting
Since the NuSTAR and XMM-Newton observations for both sources were not conducted simultaneously, we evaluated whether joint spectral fitting is feasible based on individual and simultaneous spectral analyses. We selected an overlapping energy range of 3−10 keV between the two satellites. Within this energy band, the spectra of both sources were well modeled by an absorbed PL. The model was established within XSPEC as const × tbabs × ztbabs × powerlaw. The tbabs represents Galactic hydrogen column density (NH, G), fixed at 5.88 × 1020 cm−2 and 1.61 × 1020 cm−2 for NGC 315 and NGC 4261 (HI4PI Collaboration 2016), respectively, ztbabs denotes intrinsic hydrogen column density (NH), the PL function is
 (4)
(4)
where K is the normalization (Norm) and Γ is the photon spectral index.
Firstly, the observational data from the two satellites were fitted individually for each source. As shown in Table 3, the derived values of fitting parameters remain consistent within their error ranges for the two different satellite datasets, including the absorption-corrected luminosity in the 3−10 keV (L3 − 10 keV). These results indicate that no flux or spectral variation is observed for either source over the two satellite observation periods.
Subsequently, we performed joint spectral fitting of the NuSTAR and XMM-Newton data in the 3−10 keV energy range using a consistent model. The parameter variations in the joint spectral fits were assessed following the method outlined in Hernández-García et al. (2014), using χ2/d.o.f. (where d.o.f. is degrees of freedom) and F test to determine the optimization of the fits. Specifically, it is divided into three steps:
-
SMF0 (simultaneous fitting with no variability): Using the same model, the three parameters of Norm, NH, and Γ for both satellite datasets were linked to have identical values during the joint spectral fitting for each source.
-
SMF1: One of the three parameters (Norm, NH, and Γ) was allowed to vary independently between the two satellite datasets, while the other two parameters remained linked during the joint spectral fitting for each source. Each parameter was individually tested in separate fits.
-
SMF2: Two of the three parameters (Norm, NH, and Γ) were permitted to vary independently between the two satellite datasets, while the remaining parameter remained linked during the joint spectral fitting for each source. Each combination of two varying parameters was tested separately.
The optimization of different fitting scenarios is evaluated by employing the F test, defined as
 (5)
(5)
where χ12 and d.o.f.1 represent the chi-square value and degrees of freedom for the model in scenario SMF0 (model 1), and χ22 and d.o.f.2 are those derived from the model in scenario SMF1 or SMF2 (model 2). The calculated F value yields an associated confidence level (PF − T), indicating the statistical preference of model 2 over model 1. A comprehensive summary of the comparison results across all scenarios is presented in Table 2. It is found that the best fit results for the joint spectra of both sources favor the SMF0 scenario. The best-fit results for the joint spectra in the 3−10 keV band are presented in Table 3. The derived parameter values from the joint spectral fitting are consistent with those obtained from individual spectral fitting within their uncertainties, while exhibiting relatively small errors. This indicates that the combined spectral fitting approach is both feasible and effective in providing improved parameter constraints. In the following sections we present the joint spectral fitting analysis of the NuSTAR and XMM-Newton data across the 0.5−30 keV energy range for the two sources.
F test results for various scenarios in combined spectral analysis.
Individual and simultaneous spectral analysis results for NGC 315 and NGC 4261.
3.2.2. Joint spectral fitting of NGC 315
The joint spectrum of NGC 315 was first fitted using the mekal component and absorbed PL (Eq. 4). The model implemented in XSPEC is expressed as const × tbabs × (mekal + ztbabs × powerlaw). The mekal component represents the extended thermal diffusive X-ray emission, a characteristic radiation feature commonly observed in early-type galaxies. The absorption-corrected luminosity of this component is (1.65 ± 0.19)×1041 erg s−1, which is consistent with previously reported values (Lakhchaura et al. 2018). The tbabs represents the density of the Galactic hydrogen column, which was fixed at 5.88 × 1020 cm−2 (HI4PI Collaboration 2016), while ztbabs denotes the intrinsic hydrogen column density (NH). This model produces a statistically acceptable result, yielding χ2/d.o.f. = 269.53/221, NH = 0.15 × 1022 cm−2, and a photon index  . However, significant residuals are observed around 6−7 keV. To address this, a gaussian model was introduced to characterize the Fe emission line, leading to an improved fit with χ2/d.o.f. = 248.35/218.
Best-fit parameters of the spectral analysis for NGC 315.
To investigate the existence of the high-energy cutoff energy, the powerlaw model was replaced with the cutoffpl model, resulting in χ2/d.o.f. = 240.89/217. We quantitatively evaluated whether the inclusion of the high-energy cutoff component significantly improves the spectral fitting by employing an F test. According to Eq. (5), χ12 and d.o.f.1 represent the chi-square values and degrees of freedom obtained from the powerlaw model, while χ22 and d.o.f.2 correspond to those from the cutoffpl model. The F test yields a value of F ∼ 6.72, which corresponds to a confidence level of PF − T ∼ 99%. This suggests that the fit improves upon introducing the high-energy cutoff component. However, it should be noted that the null hypothesis of this test assumes that no cutoff energy is required, i.e., Ecut → ∞. It violates a standard assumption of the F test, potentially leading to an overestimation of the significance of the improvement in goodness of fit. To further examine this issue, we also employed the Akaike information criterion (AIC; Akaike 1974) for model comparison, where AIC = χ2 + 2k, with k representing the number of free parameters. The calculated ΔAIC value, defined as AICpl − AICcut, is 5.46. Here, AICpl represents the AIC value of the powerlaw model, while AICcut corresponds to the AIC value of the cutoffpl. This result supports that the cutoffpl model is superior to powerlaw model. The fitting results for both models are presented in Fig. 2. The cutoffpl model yields a cutoff energy  keV and a photon spectral index
  . The 1σ, 2σ, and 3σ contours of Ecut and Γ are depicted in Fig. 3. Additionally, the derived energy (Egaussian) and linewidth (σgaussian) of the Fe emission line are determined to be Egaussian = 6.35 ± 0.10 keV and
  , respectively. To investigate the possibility of ionized Fe emission lines, we attempted to fit the spectrum again using two gaussian components with central energies fixed at 6.4 keV and 6.7 keV, respectively. However, this approach results in a poorer fitting outcome.
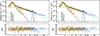 |
Fig. 2. Joint spectral fitting results for NGC 315. Left panel: Fitted spectrum comprising a PL, thermal emission from diffuse gas, and a Gaussian line. Right panel: Fitted spectrum comprising a cutoff PL, thermal emission from diffuse gas, and a Gaussian line. |
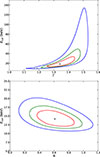 |
Fig. 3. Contour plots of NGC 315 illustrating the relationships between the cutoff energy and photon spectral index (top panel) and between the cutoff energy and reflection fraction (bottom panel). Red, green, and blue lines represent 1σ, 2σ, and 3σ contours, respectively. |
The detection of the Fe emission line in the X-ray spectrum of NGC 315 suggests the presence of a reflection component. Accordingly, the spectrum was fitted using the pexmon model, which incorporates neutral reflection components. The primary continuum of this model is characterized by the cutoff PL spectrum, which self-consistently produces the neutral Fe Kα line (Nandra et al. 2007). The inclination angle between the jet and the line of sight was fixed at 38° (Worrall et al. 2007), solar elemental abundance was assumed (Younes et al. 2019), and the iron metallicity (AFe) was allowed to vary freely. Under this scenario, the model achieves a satisfactory fit with χ2/d.o.f. = 242.84/218, yielding a cutoff energy  keV, a reflection fraction
  , and
, and  . The 1σ, 2σ, and 3σ confidence contours for Ecut and R are illustrated in Fig. 3. Considering that the Fe emission line may originate from distant Compton-thin materials, we also used the MYTorus model (Murphy & Yaqoob 2009; Yaqoob 2012) to fit the joint spectrum. This model incorporates a cutoff PL primary continuum, a reprocessed scattered continuum, and a neutral Fe Kα emission line. The Ecut was fixed at 18.45 keV, as determined by the cutoffpl model, and the torus opening angle was set to 38°. This model also provides an accepted fit, with χ2/d.o.f. = 239.34/217. The hydrogen column density of the reflecting material is estimated to be
  cm−2.
cm−2.
Finally, we conducted a fit of the joint spectrum by considering the emission model. Assuming that the bremsstrahlung radiation from a hot accretion flow constitutes the primary continuum, we used the zbremss model to fit the data, achieving an acceptable fitting result with χ2/d.o.f. = 241.23/218. The plasma temperature (kT) is determined to be  keV. Subsequently, we fitted the joint spectrum using the compTT model in XSPEC, hypothesizing that the primary continuum arises from Comptonization within either the hot accretion flow or the corona plasma. The Compton clouds were modeled as slab and spherical geometries, with geometric switches set to 0.5 for the slab and 2 for the sphere, respectively. In both cases, the corresponding β parameter was calculated analytically from the optical depth (τ). Assuming a seed photon temperature of 10 eV in both scenarios (Younes et al. 2019), we obtained lower limits on the plasma temperature of 40 keV at the 3σ confidence level. Both slab and spherical configurations yield good fits, with χ2/d.o.f. values of 246.90/217 and 247.11/217, respectively. The 1σ, 2σ, and 3σ contours of the τ and kT are presented in Fig. 4. In both cases, the kT ranges from 40 keV to 75 keV, while the τ in the spherical geometry is approximately 2−3 times greater than that in the slab geometry. It is evident that the τ and the kT exhibit significant degeneracy. All fitting parameters are summarized in Table 4, and further discussion is provided in Sect. 4.
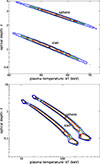 |
Fig. 4. Contour plots of plasma temperature and optical depth obtained using the compTT model for NGC 315 (top panel) and NGC 4261 (bottom panel). Red, green, and blue lines represent 1σ, 2σ, and 3σ contours, respectively. |
3.2.3. Joint spectral fitting of NGC 4261
For NGC 4261, the initial model consists of a thermal diffuse emission component and an absorbed PL model, which fails to adequately fit the observed data. We therefore introduced an additional absorbed PL component. The model implemented in XSPEC is formulated as const × tbabs × (mekal + ztbabs × (powerlaw + powerlaw)), where tbabs represents the Galactic hydrogen column density, fixed at 1.61 × 1020 cm−2 (HI4PI Collaboration 2016), the ztbabs denotes the intrinsic hydrogen column density. However, this model produced poor fitting results, with χ2/d.o.f. = 768.19/364. Therefore, we modified the model by introducing an additional ztbabs component, resulting in the formulation: const × tbabs × (mekal + ztbabs × powerlaw + ztbabs × powerlaw). This adjustment significantly improved the fit, yielding χ2/d.o.f. = 467.56/363. The absorption-corrected luminosity of the extended thermal component is (0.61 ± 0.01)×1041 erg s−1, which is consistent with the historical result (Lakhchaura et al. 2018). This emission is also attributed to hot gas in the host galaxies. The fitting results reveal a soft PL (SPL) component with a photon index of  and an absorbed column density of approximately 0.13 × 1022 cm−2, while the hard PL (HPL) component exhibits a photon index of 2.07 ± 0.09 and an absorbed column density of approximately 9.01 × 1022 cm−2. Notably, the difference between the two photon indices exceeds their respective uncertainties, and the SPL component exhibits significantly less absorption compared to the HPL component.
To assess whether the SPL and HPL components share a common origin, we linked their photon spectral indices during spectral fitting, resulting in a worse fit with χ2/d.o.f. = 471.74/364. Furthermore, we replaced the two PL models with partial coverage absorption models using the zpcFabs model to represent the partial absorber, which produced a similarly poor fit with χ2/d.o.f. = 471.74/364. Therefore, the SPL and HPL components are distinct in origin. According to Zezas et al. (2005), the SPL component likely arises from synchrotron radiation of the inner jets. As shown in Table 6, the normalization ratio of the SPL to HPL components in the XMM-Newton data increases with radius, indicating that the relative contribution of the SPL component becomes more significant at larger radii. This observation further supports the jet origin of the SPL component. Therefore, in our subsequent analysis, we focused on modifying only the HPL component to explore potential physical scenarios related to the disk-corona system.
Best-fit parameters of the spectral analysis for NGC 4261.
Best-fit spectral parameters from XMM-Newton observations at different radii for NGC 4261.
To investigate the presence of an Fe emission line, a Gaussian component was introduced into the HPL continuum, yielding a marginally improved fit with χ2/d.o.f. = 459.36/360. Although the F test indicates a confidence level of PF − T > 90% for the improvement in fit quality, it is acknowledged that the F test is not ideal for verifying the presence of emission lines (Protassov et al. 2002). The final fitted spectrum is shown in Fig. 5, and the fitting parameters are shown in Table 5. The derived energy of the Fe emission line is 6.71 ± 0.13 keV, corresponding to ionized Fe XXV, aligning with findings reported by Sambruna et al. (2003). To assess whether the Fe line of NGC 4261 is related to the diffuse thermal component, XMM-Newton data extracted from progressively larger radii were analyzed using the same spectral model. The results are presented in Table 6. The Fe emission line appears to originate predominantly from the nuclear region, with further interpretation provided in Sect. 4.2.
 |
Fig. 5. Best-fit result of the NuSTAR+XMM-Newton spectrum for NGC 4261. The fitted spectrum includes a SPL, a HPL, thermal emission from diffuse gas, and a Gaussian line. |
We replaced the powerlaw model with a cutoffpl model; however, the fitting results are not improved, yielding χ2/d.o.f. = 459.43/359. The cutoff energy is found to be 500 keV, which corresponds to the maximum limit of the cutoffpl model. The current data do not provide statistically significant evidence of the presence of a high-energy cutoff. Therefore, we opted to describe the primary continuum of NGC 4261 using a simple powerlaw model.
We also used the pexmon model to constrain potential reflection components. The disk inclination angle was fixed at 63° (Piner et al. 2001), the solar elemental abundance was assumed, and the cutoff energy was fixed at 500 keV. Due to parameter non convergence, the Gaussian component parameters were set to the values obtained from the powerlaw model fitting. This model produces a statistically acceptable fit with χ2/d.o.f. = 458.81/361. The reflection fraction is determined to be  .
.
Similar to NGC 315, we incorporated a radiation model to fit the joint spectrum of NGC 4261. The zbremss model was employed to simulate the bremsstrahlung radiation from electrons in the hot accretion flows. However, it yields a suboptimal fitting result with χ2/d.o.f. = 466.77/360. The parameters associated with the Fe emission line could not be reliably constrained; fixing them based on the results from the PL model fitting further degrades the quality of the fit. Subsequently, the compTT model was used to establish an allowable parameter space for the optical depth and the temperature of the plasmas. Both slab and spherical geometries provide satisfactory fits, with kT being less than 500 keV at a 3σ confidence level. The 1σ, 2σ, and 3σ contours of the τ and kT are displayed in Fig. 4. The detailed results are summarized in Table 5.
4. Discussion
The broadband X-ray spectra of two LLAGNs, NGC 315 and NGC 4261, in the 0.5−30 keV band, were thoroughly analyzed using data obtained from NuSTAR and XMM-Newton observations. A model consisting of a soft component, a cutoff PL, and a Gaussian component provides a good fit to the spectrum of NGC 315. The spectral fitting of NGC 4261 requires a combination of a soft component, two PLs, and a Gaussian component. This section presents a detailed discussion on the fitting results.
4.1. Evidence of the existence of RIAF
The X-ray continuum of NGC 315 is described well by a cutoff PL model with a cutoff energy  keV, a spectral feature commonly associated with the disk corona. For NGC 4261, the X-ray continuum requires two distinct PL components for an adequate fitting. The photon spectral indices are Γ1 ∼ 2.10 for the HPL component and Γ2 ∼ 2.89 for the SPL component. Nemmen et al. (2014) suggested that the RIAF model tends to predict a harder X-ray spectrum compared to the jet model. The photon spectral index of Γ1 ∼ 2.10 for the HPL component aligns well with the range of 1.4−2.2 observed in typical LLAGNs (Wong et al. 2024), thereby supporting the RIAF origin for the HPL component. The SPL component is likely associated with jet emission. As displayed in Fig. 5, the flux contribution from the HPL component exceeds that of the SPL component, indicating that the X-ray continuum of NGC 4261 is predominantly produced by the RIAF rather than jet radiation. This is consistent with the findings of Sambruna et al. (2003) and Nemmen et al. (2014). This further corroborates the primary role of RIAF in producing the HPL emission. Additionally, the detection of Fe emission lines in both sources supports the RIAF origin for their X-ray emission.
A negative correlation between Γ and λEdd has been found in LLAGNs (e.g., Gu & Cao 2009; Younes et al. 2011; She et al. 2018; Diaz et al. 2023), which can be naturally explained by the RIAF model (Yang et al. 2015). Based on a sample of 30 AGNs with λEdd < 10−3 observed by the Swift/Burst Alert Telescope, Jana et al. (2023) reported a weak negative correlation between Γ and λEdd. The spectral indices of NGC 315 and NGC 4261 also follow the statistically negative correlation with the Eddington ratio, as shown in Fig. 6. For comparison, the fitting lines for the LLAGN samples from Gu & Cao (2009), She et al. (2018), and Diaz et al. (2023) are also presented in Fig. 6. However, the inherent limitations of the available sample introduce uncertainty into the quantification of this negative correlation coefficient.
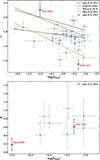 |
Fig. 6. Photon spectral index (Γ; top panel) and reflection fraction (R; bottom panel) as a function of Eddington ratio (λEdd). The red dots denote NGC 315 and NGC 4261. The blue dots and the dashed black line correspond to the results obtained from Jana et al. (2023). The dashed maroon, dark yellow, and green lines in the bottom panel correspond to the fitting lines for their samples from Gu & Cao (2009), She et al. (2018), and Diaz et al. (2023), respectively. |
Neither NGC 315 nor NGC 4261 shows evidence of a Compton reflection bump in the hard X-rays, which is a characteristic feature commonly observed in LAGNs. For LAGNs with λEdd ≳ 10−2, the reflection fraction is typically higher (R > 0.3), which can be attributed to the reflection features of standard accretion disks (Lubiński et al. 2016). In contrast, most studied LLAGNs with low Eddington ratios exhibit a significantly lower reflection fraction, as demonstrated by sources such as M 81 (Young et al. 2018), NGC 7231 (Ursini et al. 2015), NGC 3998, and NGC 4579 (Younes et al. 2019). For NGC 4261, a reflection fraction of R ∼ 0.18 is obtained, and no neutral Fe Kα line is detected in its X-ray spectrum. These findings support the point that most LLAGNs lack significant reflection from standard accretion disks. Conversely, NGC 315 exhibits a relatively high reflection fraction of R ∼ 0.61, which may be due to its accretion disk having a smaller truncation radius, allowing for partial reflection of X-rays. Using the data from 7 sources with constrained reflection fractions from Jana et al. (2023), together with that of NGC 315 and NGC 4261, we plot R as a function of λEdd in Fig. 6. It seems likely that there is a correlation between R and λEdd. We used the bootstrap method to sample within the error range (Efron 1979) and estimate the correlation coefficient (r) between R and λEdd. However, the estimation yields r = 0.34, indicating only a weak tendency toward a positive correlation. Therefore, a higher Eddington ratio may result in a smaller truncation radius (Zhang et al. 2025), which can also explain the neutral Fe Kα line detected in NGC 315.
4.2. Possible origins of the Fe emission lines
Iron emission lines are seen in both NGC 315 and NGC 4261, corresponding to the neutral Fe Kα line at 6.34 keV in NGC 315 and the ionized Fe XXV line at 6.7 keV in NGC 4261. These findings align with previous studies, including the detection of the Fe Kα line in NGC 315 by González-Martín et al. (2009), and the observation of the unresolved Fe emission features around ∼7 keV in NGC 4261 by Sambruna et al. (2003). However, the exact origin of these features remains undetermined due to uncertainties in the width of these Fe lines.
A high reflection fraction of R ∼ 0.61 is derived for NGC 315. As discussed in Sect. 4.1, this suggests the presence of a truncated disk with a relatively small radius in NGC 315. Using the neutral cold matter reflection model pexmon, which incorporates the reflection of Fe Kα (Nandra et al. 2007), a satisfactory fit to the X-ray spectrum is obtained, as shown in Table 4. Therefore, the Fe emission line observed in NGC 315 is likely attributed to reflection from the truncated accretion disk. Alternatively, a Compton-thin origin for the Fe Kα emission line cannot be ruled out, as the MYTorus model also yields a good fit to the data (Table 4). The column density of the Compton-thin regions is measured to be  cm−2; however, the spatial extent or distance of these regions from the central nucleus remains unclear. These regions may correspond to either the broad-line region or the dusty torus, as suggested by previous studies (Ursini et al. 2015; Young et al. 2018; Younes et al. 2019).
To investigate the potential diffuse emission origin of the ionized Fe emission line detected in NGC 4261, we extracted XMM-Newton spectra with different radial sizes. As shown in Table 5, the significance of the Fe emission line increases with decreasing data extraction radius, suggesting that the Fe emission line originates from the nuclear region, consistent with previous studies (Sambruna et al. 2003). Furthermore, the Fe emission line is unlikely to be associated with the ionized disk, given the strong positive dependence of the disk’s ionization parameters on the mass accretion rate and the requirement for λEdd > 0.5 to produce ionized Fe emission line (Matt et al. 1993; Sambruna et al. 2003). Therefore, the highly ionized Fe XXV line observed in NGC 4261 can be attributed to hot accretion flows, similar to other LLAGNs (Younes et al. 2019; Young et al. 2007).
4.3. Cutoff energy and cooling mechanism of plasma
A cutoff energy of  keV, the lowest value ever observed in LLAGNs, is obtained for NGC 315. Through sample analysis, Ricci et al. (2018) reported that there is an anticorrelated trend between the cutoff energy and Eddington ratio for typical AGNs; the median cutoff energy (Ecut) is 160 ± 41 keV for AGNs with λEdd > 0.1, while the median is 370 ± 51 keV for AGNs with λEdd ≤ 0.1. This anticorrelation can be attributed to the fact that the more compact the radiation is, the more effective the energy exchange of the plasma, resulting in a lower coronal temperature (Laha et al. 2025). However, similar to other LLAGNs with low accretion rates, such as 3C 264 and NGC 3998 (Wong et al. 2024; Younes et al. 2019), NGC 315 does not follow this pattern, suggesting that this trend is different in AGNs with extremely low Eddington ratios.
The low value of Ecut observed in NGC 315 suggests the temperature of its plasma is relatively low. As discussed in Sect. 4.1, NGC 315 may harbor a truncated accretion disk with a small truncation radius. The Comptonization of disk photons could serve as an effective mechanism for cooling the hot electrons within the plasma; the efficiency of this cooling process tends to increase as the truncation radius decreases (Tortosa et al. 2018). To assess whether this process is the dominant cooling mechanism, we employed the results from compTT model fitting to constrain the temperature and optical depth of the plasma. Both the slab and spherical configurations for the plasma clouds give acceptable fits, as presented in Table 4. However, there is a notable parameter degeneracy between kTe and τ in both cases. As shown in Fig. 4, the lower limit of kTe at the 3σ confidence level exceeds 40 keV. Using the empirical relationships Ecut = 2kTe for τ < 1 and Ecut = 3kTe for τ ≫ 1 (Petrucci et al. 2001), the cutoff energy derived from the compTT model is significantly higher than that obtained using the cutoffpl model. Given this discrepancy, it is plausible that Comptonization does not dominate the cooling process.
To further explore the properties of the plasma clouds, we calculated the dimensionless compaction parameter (ℓ) and the dimensionless electron temperature (Θ) using the following equations (Fabian et al. 2015):
 (6)
(6)
 (7)
(7)
where RX is the coronal size, Rg is the gravitational radius, mp and me are the masses of the proton and electron, respectively, and LX is the coronal luminosity in the 0.1−200 keV band. We took the typical value of LAGNs, RX = 10 Rg, as the lower limit of the radiation area size, since the size of the radiation area in LLAGNs may be larger (Younes et al. 2019). LX ∼ 7.83 × 1041 erg s−1 is obtained through the extrapolation of the best-fitted cutoffpl model. Together with Ecut = 18.45 keV and Ecut = 2kTe, we obtain ℓ ∼ 0.05 and Θ ∼ 0.02 for NGC 315. In the ℓ − Θ diagram (Fig. 1 in Fabian et al. 2015), NGC 315 lies below the bremsstrahlung cooling line (tB = tC), indicating that bremsstrahlung dominates the cooling process. Additionally, NGC 315 is located below the electron–proton (e− − p) coupling line, distinct from those LAGNs that are typically found near the electron–electron (e− − e−) coupling line. This discrepancy is evidence that the physical properties of the X-ray emission region in LLAGNs are different from those of LAGNs (Jana et al. 2023; Younes et al. 2019).
The zbremss model also produces a good fit, corresponding to the electron temperature kTe ∼ 16.96 keV. In the process of bremsstrahlung radiation, the relationship between the cutoff energy and electron temperature is Ecut = kTe (Rybicki & Lightman 1979, Chap. 5). The cutoff energy corresponding to this temperature is consistent with the cutoff energy fitted by the cutoffpl model within the error range, which can explain the lower cutoff energy of NGC 315. However, it is unclear whether the temperature of the accretion flow in the vicinity of the black hole can be so low. The bremsstrahlung process may occur in the transition zone outside the RIAF near the Bondi radius and dominate the X-ray radiation. This theoretical scenario has been successfully applied to explain the X-ray spectrum of Sgr A* (Quataert 2002; Yuan et al. 2003; Wong et al. 2024).
For NGC 4261, the X-ray spectrum is described well by the PL model, with no significant constraint on a cutoff energy. As shown in Table 5, the spectral fitting using the zbremss model results in a suboptimal fit and yields a very low electron temperature of kTe ∼ 10.86 keV. In contrast, the compTT model provides a satisfactory fit, comparable to that obtained with the PL model. Using Eqs. (6) and (7), we estimated the values of ℓ and Θ for NGC 4261 by assuming RX = 10 Rg and an extrapolated X-ray luminosity of LX ∼ 7.03 × 1041 erg s−1. By considering the upper (kTe ∼ 500 keV) and lower (kTe ∼ 10 keV) bounds of the electron temperature at the 3σ confidence level derived from Fig. 4, we obtain ℓ ∼ 0.02 and Θ ∼ 0.02 − 0.98. In the ℓ − Θ parameter space, NGC 4261 may lie below the e− − p coupling line; however, it could also be closer to the e− − e− coupling line. The Comptonization within RIAF may be the dominant mechanism responsible for the HPL spectrum observed in NGC 4261. Future soft MeV missions will further limit the high-energy cutoff in LLAGNs spectra to better understand the physical properties of high-energy emission regions in these sources.
5. Summary
In this study, using NuSTAR and high-quality historical XMM-Newton observations, we conducted broadband X-ray timing and spectral analysis for two LLAGNs, NGC 315 and NGC 4261. The main results are summarized as follows:
-
No significant variability on timescales of days is observed in either of the two sources during the NuSTAR and XMM-Newton observation periods. Despite the NuSTAR and XMM-Newton observations not being conducted synchronously for both sources, the derived fluxes within the overlapping energy range (3−10 keV) of the two satellites are consistent within their uncertainties; the spectral parameters also agree.
-
The broadband 0.5−30 keV spectrum of NGC 315 is composed of three components: thermal emission from diffuse gas, a cutoff PL, and an emission line. The derived cutoff energy
 keV is the lowest ever observed in a LLAGN. The energy of the emission line (Egaussian) is measured to be 6.34 ± 0.09 keV, which corresponds to the neutral Fe Kα line.
 -
The observed spectrum of NGC 315 appears to be consistent with the bremsstrahlung model, yielding an electron temperature (kTe) of
 keV. This value aligns well with the cutoff energy
  keV derived from the cutoffpl model.
 -
The broadband 0.5−30 keV spectrum of NGC 4261 is characterized by four components: thermal emission from diffuse gas, two PLs, and the ionized Fe XXV line. Our analysis reveals two markedly different photon spectral indices and absorbed column densities: Γ1 = 2.10 ± 0.09 with
 cm−2 for the HPL component, and
  with NH2 = (0.14 ± 0.05)×1022 cm−2 for the SPL component. The HPL component is contributed by the RIAF, while the SPL component likely originates from the jet. The energy of the emission line (Egaussian) is measured to be 6.71 ± 0.13 keV, which corresponds to the ionized Fe XXV line.
 -
The X-ray spectrum of NGC 4261 is described better by a Comptonization model with either a slab or spherical geometry than by the bremsstrahlung model. The plasma temperature is estimated to be in the range 10−250 keV for the slab geometry and 20−500 keV for the spherical geometry at a 3σ confidence level, corresponding to optical depths in the ranges 0.05−3.0 and 0.08−4.0, respectively.
-
The reflection fractions (R) of NGC 4261 and NGC 315 we derive are
 and
and  , respectively. Neither NGC 4261 nor NGC 315 exhibits prominent reflection bumps.
The high reflection fraction obtained in NGC 315, together with the detection of a neutral Fe Kα line, suggests the presence of a truncated accretion disk with a relatively small radius. This configuration can be attributed to its comparatively higher accretion rate. The low cutoff energy (Ecut) of  keV implies a relatively low plasma temperature in NGC 315, which is consistent with the bremsstrahlung model being an appropriate description of its X-ray spectrum. Furthermore, the ℓ − Θ relation supports bremsstrahlung as the dominant cooling mechanism in NGC 315. In contrast, the X-ray spectrum of NGC 4261 is contributed by both the inner jet and the RIAF, with the latter being dominant. The continuum spectrum from RIAF is described well by a PL model, and no significant cutoff energy is constrained. Unlike NGC 315, the X-ray emission from the RIAF in NGC 4261 favors Comptonization as the primary cooling mechanism.
Thus far, our understanding of the X-ray emission properties of LLAGNs remains limited, as does the availability of statistically significant observational samples. Future in-depth observations utilizing broader hard X-ray bands extending up to 100 keV, along with improved sensitivity and higher energy resolution, are expected to provide tighter constraints on the Ecut values and iron emission line features. This will significantly enhance our understanding of the X-ray radiation mechanisms and accretion physics in LLAGNs.
For simplicity, we use the term “disk corona” to indicate any type of accretion flow at work around the black hole.
Acknowledgments
We sincerely appreciate the referee for the valuable suggestions, which have greatly enhanced the quality of the manuscript. We also appreciate helpful discussion with Yanli Ai and Dabin Lin. This work made use of data from the NuSTAR mission, a project led by the California Institute of Technology (Caltech), managed by the Jet Propulsion Laboratory (JPL), and funded by NASA. We thank the NuSTAR Operations, Software, and Calibration teams for their support with the data analysis. This work is supported by the National Key R&D Program of China (grant 2023YFE0117200) and the National Natural Science Foundation of China (grants 12022305 and 11973050).
References
- Abdollahi, S., Acero, F., Baldini, L., et al. 2022, ApJS, 260, 53 [NASA ADS] [CrossRef] [Google Scholar]
- Akaike, H. 1974, IEEE Trans. Autom. Control, 19, 716 [Google Scholar]
- Almeida, I., Duarte, R., & Nemmen, R. 2022, MNRAS, 509, 5657 [Google Scholar]
- Arnaud, K. A. 1996, ASP Conf. Ser., 101, 17 [Google Scholar]
- Ballet, J., Bruel, P., Burnett, T. H., Lott, B., & TheFermi-LAT Collaboration 2023, ArXiv e-prints [arXiv:2307.12546] [Google Scholar]
- Binder, B., Markowitz, A., & Rothschild, R. E. 2009, ApJ, 691, 431 [Google Scholar]
- Chen, K., & Halpern, J. P. 1989, ApJ, 344, 115 [NASA ADS] [CrossRef] [Google Scholar]
- Cotton, W. D., Feretti, L., Giovannini, G., Lara, L., & Venturi, T. 1999, ApJ, 519, 108 [Google Scholar]
- Diaz, Y., Hernàndez-García, L., Arévalo, P., et al. 2023, A&A, 669, A114 [NASA ADS] [CrossRef] [EDP Sciences] [Google Scholar]
- Donato, D., Sambruna, R. M., & Gliozzi, M. 2004, ApJ, 617, 915 [Google Scholar]
- Efron, B. 1979, Ann. Stat., 7, 1 [Google Scholar]
- Eracleous, M., Hwang, J. A., & Flohic, H. M. L. G. 2010, ApJS, 187, 135 [NASA ADS] [CrossRef] [Google Scholar]
- Evans, D. A., Worrall, D. M., Hardcastle, M. J., Kraft, R. P., & Birkinshaw, M. 2006, ApJ, 642, 96 [Google Scholar]
- Fabian, A. C., Lohfink, A., Kara, E., et al. 2015, MNRAS, 451, 4375 [Google Scholar]
- Flohic, H. M. L. G., Eracleous, M., Chartas, G., Shields, J. C., & Moran, E. C. 2006, ApJ, 647, 140 [Google Scholar]
- Fukazawa, Y., Finke, J., Stawarz, Ł., et al. 2015, ApJ, 798, 74 [Google Scholar]
- Gliozzi, M., Sambruna, R. M., & Brandt, W. N. 2003, A&A, 408, 949 [NASA ADS] [CrossRef] [EDP Sciences] [Google Scholar]
- González-Martín, O., & Vaughan, S. 2012, A&A, 544, A80 [NASA ADS] [CrossRef] [EDP Sciences] [Google Scholar]
- González-Martín, O., Masegosa, J., Márquez, I., Guainazzi, M., & Jiménez-Bailón, E. 2009, A&A, 506, 1107 [NASA ADS] [CrossRef] [EDP Sciences] [Google Scholar]
- Gu, M., & Cao, X. 2009, MNRAS, 399, 349 [NASA ADS] [CrossRef] [Google Scholar]
- Gu, Q. S., Huang, J. S., Wilson, G., & Fazio, G. G. 2007, ApJ, 671, L105 [NASA ADS] [CrossRef] [Google Scholar]
- Harrison, F. A., Craig, W. W., Christensen, F. E., et al. 2013, ApJ, 770, 103 [Google Scholar]
- Heckman, T. M., & Best, P. N. 2014, ARA&A, 52, 589 [Google Scholar]
- Hernández-García, L., González-Martín, O., Márquez, I., & Masegosa, J. 2013, A&A, 556, A47 [NASA ADS] [CrossRef] [EDP Sciences] [Google Scholar]
- Hernández-García, L., González-Martín, O., Masegosa, J., & Márquez, I. 2014, A&A, 569, A26 [NASA ADS] [CrossRef] [EDP Sciences] [Google Scholar]
- HI4PI Collaboration (Ben Bekhti, N., et al.) 2016, A&A, 594, A116 [NASA ADS] [CrossRef] [EDP Sciences] [Google Scholar]
- Ho, L. C. 1999, ApJ, 516, 672 [NASA ADS] [CrossRef] [Google Scholar]
- Ho, L. C. 2008, ARA&A, 46, 475 [Google Scholar]
- Ho, L. C., Filippenko, A. V., & Sargent, W. L. 1995, ApJS, 98, 477 [NASA ADS] [CrossRef] [Google Scholar]
- Ho, L. C., Filippenko, A. V., Sargent, W. L. W., & Peng, C. Y. 1997, ApJS, 112, 391 [NASA ADS] [CrossRef] [Google Scholar]
- Imazawa, R., Fukazawa, Y., & Takahashi, H. 2021, ApJ, 919, 110 [NASA ADS] [CrossRef] [Google Scholar]
- Jana, A., Chatterjee, A., Chang, H.-K., et al. 2023, MNRAS, 524, 4670 [NASA ADS] [CrossRef] [Google Scholar]
- Jansen, F., Lumb, D., Altieri, B., et al. 2001, A&A, 365, L1 [NASA ADS] [CrossRef] [EDP Sciences] [Google Scholar]
- Jones, D. L., & Wehrle, A. E. 1997, ApJ, 484, 186 [NASA ADS] [CrossRef] [Google Scholar]
- Joye, W. A., & Mandel, E. 2003, ASP Conf. Ser., 295, 489 [Google Scholar]
- Laha, S., Ricci, C., Mather, J. C., et al. 2025, Front. Astron. Space Sci., 11, 1530392 [Google Scholar]
- Lakhchaura, K., Werner, N., Sun, M., et al. 2018, MNRAS, 481, 4472 [NASA ADS] [CrossRef] [Google Scholar]
- Lubiński, P., Beckmann, V., Gibaud, L., et al. 2016, MNRAS, 458, 2454 [Google Scholar]
- Matt, G., Fabian, A. C., & Ross, R. R. 1993, MNRAS, 262, 179 [NASA ADS] [CrossRef] [Google Scholar]
- Murphy, K. D., & Yaqoob, T. 2009, MNRAS, 397, 1549 [Google Scholar]
- Nagar, N. M., Falcke, H., Wilson, A. S., & Ho, L. C. 2000, ApJ, 542, 186 [Google Scholar]
- Nagar, N. M., Falcke, H., & Wilson, A. S. 2005, A&A, 435, 521 [NASA ADS] [CrossRef] [EDP Sciences] [Google Scholar]
- Nandra, K., O’Neill, P. M., George, I. M., & Reeves, J. N. 2007, MNRAS, 382, 194 [NASA ADS] [CrossRef] [Google Scholar]
- Narayan, R., & Yi, I. 1994, ApJ, 428, L13 [Google Scholar]
- Narayan, R., Mahadevan, R., & Quataert, E. 1998, in Theory of Black Hole Accretion Disks, eds. M. A. Abramowicz, G. Björnsson, & J. E. Pringle, 148 [Google Scholar]
- Nemmen, R. S., Storchi-Bergmann, T., & Eracleous, M. 2014, MNRAS, 438, 2804 [Google Scholar]
- O’Dea, C. P., & Saikia, D. J. 2021, A&ARv, 29, 3 [Google Scholar]
- Petrucci, P. O., Haardt, F., Maraschi, L., et al. 2001, ApJ, 556, 716 [Google Scholar]
- Piner, B. G., Jones, D. L., & Wehrle, A. E. 2001, AJ, 122, 2954 [NASA ADS] [CrossRef] [Google Scholar]
- Protassov, R., van Dyk, D. A., Connors, A., Kashyap, V. L., & Siemiginowska, A. 2002, ApJ, 571, 545 [NASA ADS] [CrossRef] [Google Scholar]
- Quataert, E. 2002, ApJ, 575, 855 [NASA ADS] [CrossRef] [Google Scholar]
- Rees, M. J. 1984, ARA&A, 22, 471 [Google Scholar]
- Ricci, C., Ho, L. C., Fabian, A. C., et al. 2018, MNRAS, 480, 1819 [NASA ADS] [CrossRef] [Google Scholar]
- Rybicki, G. B., & Lightman, A. P. 1979, Radiative Processes in Astrophysics (New York: Wiley-VCH) [Google Scholar]
- Sambruna, R. M., Gliozzi, M., Eracleous, M., Brandt, W. N., & Mushotzky, R. 2003, ApJ, 586, L37 [Google Scholar]
- She, R., Ho, L. C., Feng, H., & Cui, C. 2018, ApJ, 859, 152 [NASA ADS] [CrossRef] [Google Scholar]
- Sobolewska, M. A., & Papadakis, I. E. 2009, MNRAS, 399, 1597 [NASA ADS] [CrossRef] [Google Scholar]
- Storchi-Bergmann, T., Nemmen da Silva, R., Eracleous, M., et al. 2003, ApJ, 598, 956 [NASA ADS] [CrossRef] [Google Scholar]
- Strüder, L., Briel, U., Dennerl, K., et al. 2001, A&A, 365, L18 [Google Scholar]
- Terashima, Y., Iyomoto, N., Ho, L. C., & Ptak, A. F. 2002, ApJS, 139, 1 [CrossRef] [Google Scholar]
- Tomar, G., Gupta, N., & Prince, R. 2021, ApJ, 919, 137 [NASA ADS] [CrossRef] [Google Scholar]
- Tortosa, A., Bianchi, S., Marinucci, A., Matt, G., & Petrucci, P. O. 2018, A&A, 614, A37 [NASA ADS] [CrossRef] [EDP Sciences] [Google Scholar]
- Turner, M. J. L., Abbey, A., Arnaud, M., et al. 2001, A&A, 365, L27 [CrossRef] [EDP Sciences] [Google Scholar]
- Ursini, F., Marinucci, A., Matt, G., et al. 2015, MNRAS, 452, 3266 [NASA ADS] [CrossRef] [Google Scholar]
- Vaughan, S., Edelson, R., Warwick, R. S., & Uttley, P. 2003, MNRAS, 345, 1271 [Google Scholar]
- Venturi, T., Giovannini, G., Feretti, L., Comoretto, G., & Wehrle, A. E. 1993, ApJ, 408, 81 [Google Scholar]
- Wong, K.-W., Steiner, C. M., Blum, A. M., et al. 2024, ApJ, 974, 82 [Google Scholar]
- Worrall, D. M., Birkinshaw, M., & Hardcastle, M. J. 2003, MNRAS, 343, L73 [Google Scholar]
- Worrall, D. M., Birkinshaw, M., Laing, R. A., Cotton, W. D., & Bridle, A. H. 2007, MNRAS, 380, 2 [NASA ADS] [CrossRef] [Google Scholar]
- Wu, Q., Yuan, F., & Cao, X. 2007, ApJ, 669, 96 [NASA ADS] [CrossRef] [Google Scholar]
- Yang, Q.-X., Xie, F.-G., Yuan, F., et al. 2015, MNRAS, 447, 1692 [NASA ADS] [CrossRef] [Google Scholar]
- Yaqoob, T. 2012, MNRAS, 423, 3360 [Google Scholar]
- Younes, G., Porquet, D., Sabra, B., & Reeves, J. N. 2011, A&A, 530, A149 [NASA ADS] [CrossRef] [EDP Sciences] [Google Scholar]
- Younes, G., Ptak, A., Ho, L. C., et al. 2019, ApJ, 870, 73 [NASA ADS] [CrossRef] [Google Scholar]
- Young, A. J., Nowak, M. A., Markoff, S., Marshall, H. L., & Canizares, C. R. 2007, ApJ, 669, 830 [Google Scholar]
- Young, A. J., McHardy, I., Emmanoulopoulos, D., & Connolly, S. 2018, MNRAS, 476, 5698 [CrossRef] [Google Scholar]
- Yuan, F. 2007, ASP Conf. Ser., 373, 95 [Google Scholar]
- Yuan, F., & Narayan, R. 2014, ARA&A, 52, 529 [NASA ADS] [CrossRef] [Google Scholar]
- Yuan, F., Quataert, E., & Narayan, R. 2003, ApJ, 598, 301 [Google Scholar]
- Zezas, A., Birkinshaw, M., Worrall, D. M., Peters, A., & Fabbiano, G. 2005, ApJ, 627, 711 [Google Scholar]
- Zhang, L., Xue, L., Luo, J., & Li, C. 2025, A&A, 700, A150 [NASA ADS] [CrossRef] [EDP Sciences] [Google Scholar]
All Tables
Best-fit spectral parameters from XMM-Newton observations at different radii for NGC 4261.
All Figures
|
Fig. 1. XMM-Newton/pn and Nustar/FPMA background-corrected light curves with a time bin of 1 ks for NGC 315 (left panel) and NGC 4261 (right panel), corresponding to the energy ranges of 0.5−10 KeV and 3−30 keV, respectively. In each case, time zero corresponds to the start time of the observation by the respective satellite. |
| In the text | |
|
Fig. 2. Joint spectral fitting results for NGC 315. Left panel: Fitted spectrum comprising a PL, thermal emission from diffuse gas, and a Gaussian line. Right panel: Fitted spectrum comprising a cutoff PL, thermal emission from diffuse gas, and a Gaussian line. |
| In the text | |
|
Fig. 3. Contour plots of NGC 315 illustrating the relationships between the cutoff energy and photon spectral index (top panel) and between the cutoff energy and reflection fraction (bottom panel). Red, green, and blue lines represent 1σ, 2σ, and 3σ contours, respectively. |
| In the text | |
|
Fig. 4. Contour plots of plasma temperature and optical depth obtained using the compTT model for NGC 315 (top panel) and NGC 4261 (bottom panel). Red, green, and blue lines represent 1σ, 2σ, and 3σ contours, respectively. |
| In the text | |
|
Fig. 5. Best-fit result of the NuSTAR+XMM-Newton spectrum for NGC 4261. The fitted spectrum includes a SPL, a HPL, thermal emission from diffuse gas, and a Gaussian line. |
| In the text | |
|
Fig. 6. Photon spectral index (Γ; top panel) and reflection fraction (R; bottom panel) as a function of Eddington ratio (λEdd). The red dots denote NGC 315 and NGC 4261. The blue dots and the dashed black line correspond to the results obtained from Jana et al. (2023). The dashed maroon, dark yellow, and green lines in the bottom panel correspond to the fitting lines for their samples from Gu & Cao (2009), She et al. (2018), and Diaz et al. (2023), respectively. |
| In the text | |
Current usage metrics show cumulative count of Article Views (full-text article views including HTML views, PDF and ePub downloads, according to the available data) and Abstracts Views on Vision4Press platform.
Data correspond to usage on the plateform after 2015. The current usage metrics is available 48-96 hours after online publication and is updated daily on week days.
Initial download of the metrics may take a while.