Fig. 1.
Download original image
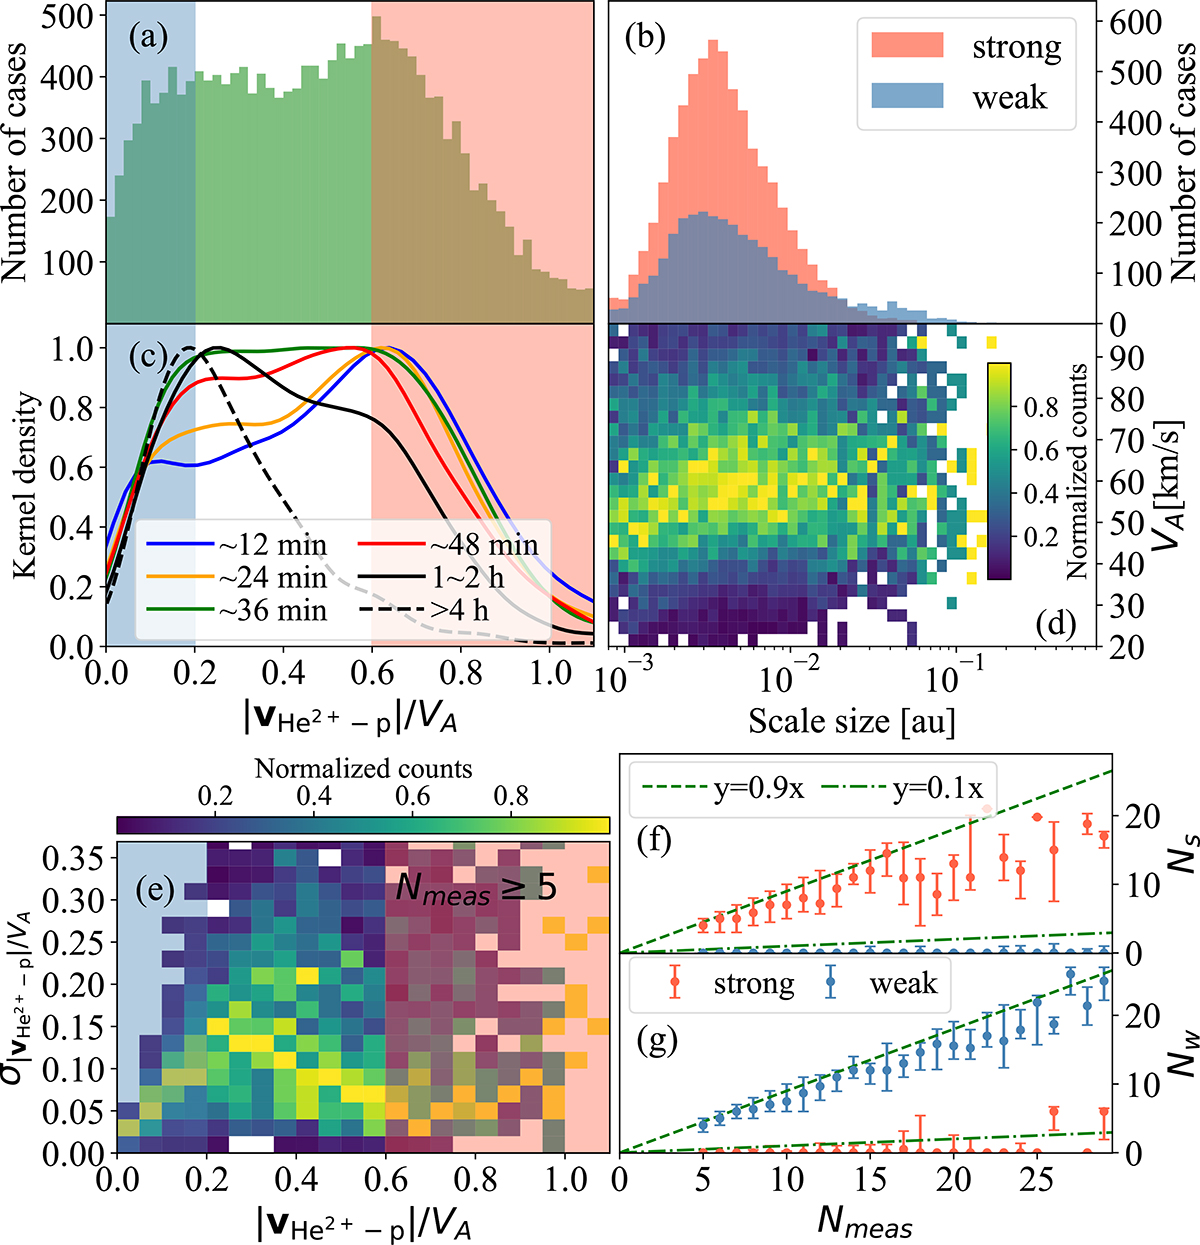
(a) Distribution of average |vHe2+ − p|/VA (bin size = 0.02). The blue (pink) area indicates weak (strong) differential streaming. (b) Scale size distributions of SFRs with strong or weak differential streaming (logarithmic bins, ![]() = 0.06 au). (c) Normalized kernel density estimation functions for SFRs with different durations. (d) 2D histogram of the scale size and average VA. Counts are normalized per x bin, with
= 0.06 au). (c) Normalized kernel density estimation functions for SFRs with different durations. (d) 2D histogram of the scale size and average VA. Counts are normalized per x bin, with ![]() = 0.06 au and Δy = 3 km/s. (e) 2D histogram of |vHe2+ − p|/VA and the related standard deviation. Counts are normalized per x bin, with Δx = 0.05 and Δy = 0.02. (f) Number of data points with strong differential streaming (Ns) related to the total number of measurements (Nmeas) within each case. Error bars represent the 16th, 50th, and 84th percentile within each x bin. (g) Same as panel f but for data points with weak differential streaming (Nw).
= 0.06 au and Δy = 3 km/s. (e) 2D histogram of |vHe2+ − p|/VA and the related standard deviation. Counts are normalized per x bin, with Δx = 0.05 and Δy = 0.02. (f) Number of data points with strong differential streaming (Ns) related to the total number of measurements (Nmeas) within each case. Error bars represent the 16th, 50th, and 84th percentile within each x bin. (g) Same as panel f but for data points with weak differential streaming (Nw).
Current usage metrics show cumulative count of Article Views (full-text article views including HTML views, PDF and ePub downloads, according to the available data) and Abstracts Views on Vision4Press platform.
Data correspond to usage on the plateform after 2015. The current usage metrics is available 48-96 hours after online publication and is updated daily on week days.
Initial download of the metrics may take a while.