Fig. 2.
Download original image
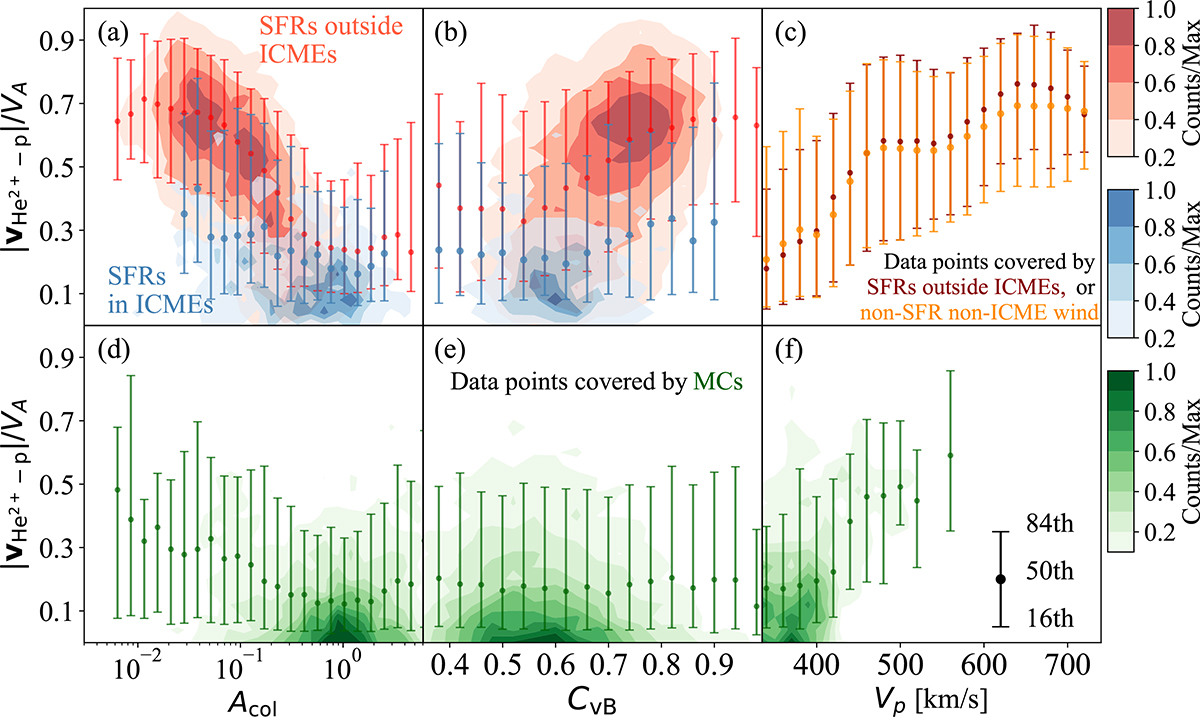
(a) Contour plots of the joint distributions between the average |vHe2+ − p|/VA and collisional age (Acol). SFRs within (outside) ICMEs are plotted in blue (red), and counts are normalized to the overall maximum. Bin sizes are ![]() = 0.13 and Δy = 0.04. Error bars represent the 16th, 50th, and 84th percentile within that x bin. (b) Contour plots of the joint distributions between the average |vHe2+ − p|/VA and the Alfvénicity parameter (CvB). Bin sizes are Δx = 0.04 and Δy = 0.04. (c) 16th, 50th, and 84th percentile of |vHe2+ − p|/VA within each proton velocity bin (bin size = 20). Data points covered by SFRs outside ICMEs are plotted in dark red, and data points covered by time periods that are neither SFRs nor ICMEs in orange. (d) Same as panel a but for data points covered by MCs. (e) Same as panel b but for data points covered by MCs. (f) Same as panel c but for data points covered by MCs, with the contour plot of the joint distribution.
= 0.13 and Δy = 0.04. Error bars represent the 16th, 50th, and 84th percentile within that x bin. (b) Contour plots of the joint distributions between the average |vHe2+ − p|/VA and the Alfvénicity parameter (CvB). Bin sizes are Δx = 0.04 and Δy = 0.04. (c) 16th, 50th, and 84th percentile of |vHe2+ − p|/VA within each proton velocity bin (bin size = 20). Data points covered by SFRs outside ICMEs are plotted in dark red, and data points covered by time periods that are neither SFRs nor ICMEs in orange. (d) Same as panel a but for data points covered by MCs. (e) Same as panel b but for data points covered by MCs. (f) Same as panel c but for data points covered by MCs, with the contour plot of the joint distribution.
Current usage metrics show cumulative count of Article Views (full-text article views including HTML views, PDF and ePub downloads, according to the available data) and Abstracts Views on Vision4Press platform.
Data correspond to usage on the plateform after 2015. The current usage metrics is available 48-96 hours after online publication and is updated daily on week days.
Initial download of the metrics may take a while.