Fig. 1
Download original image
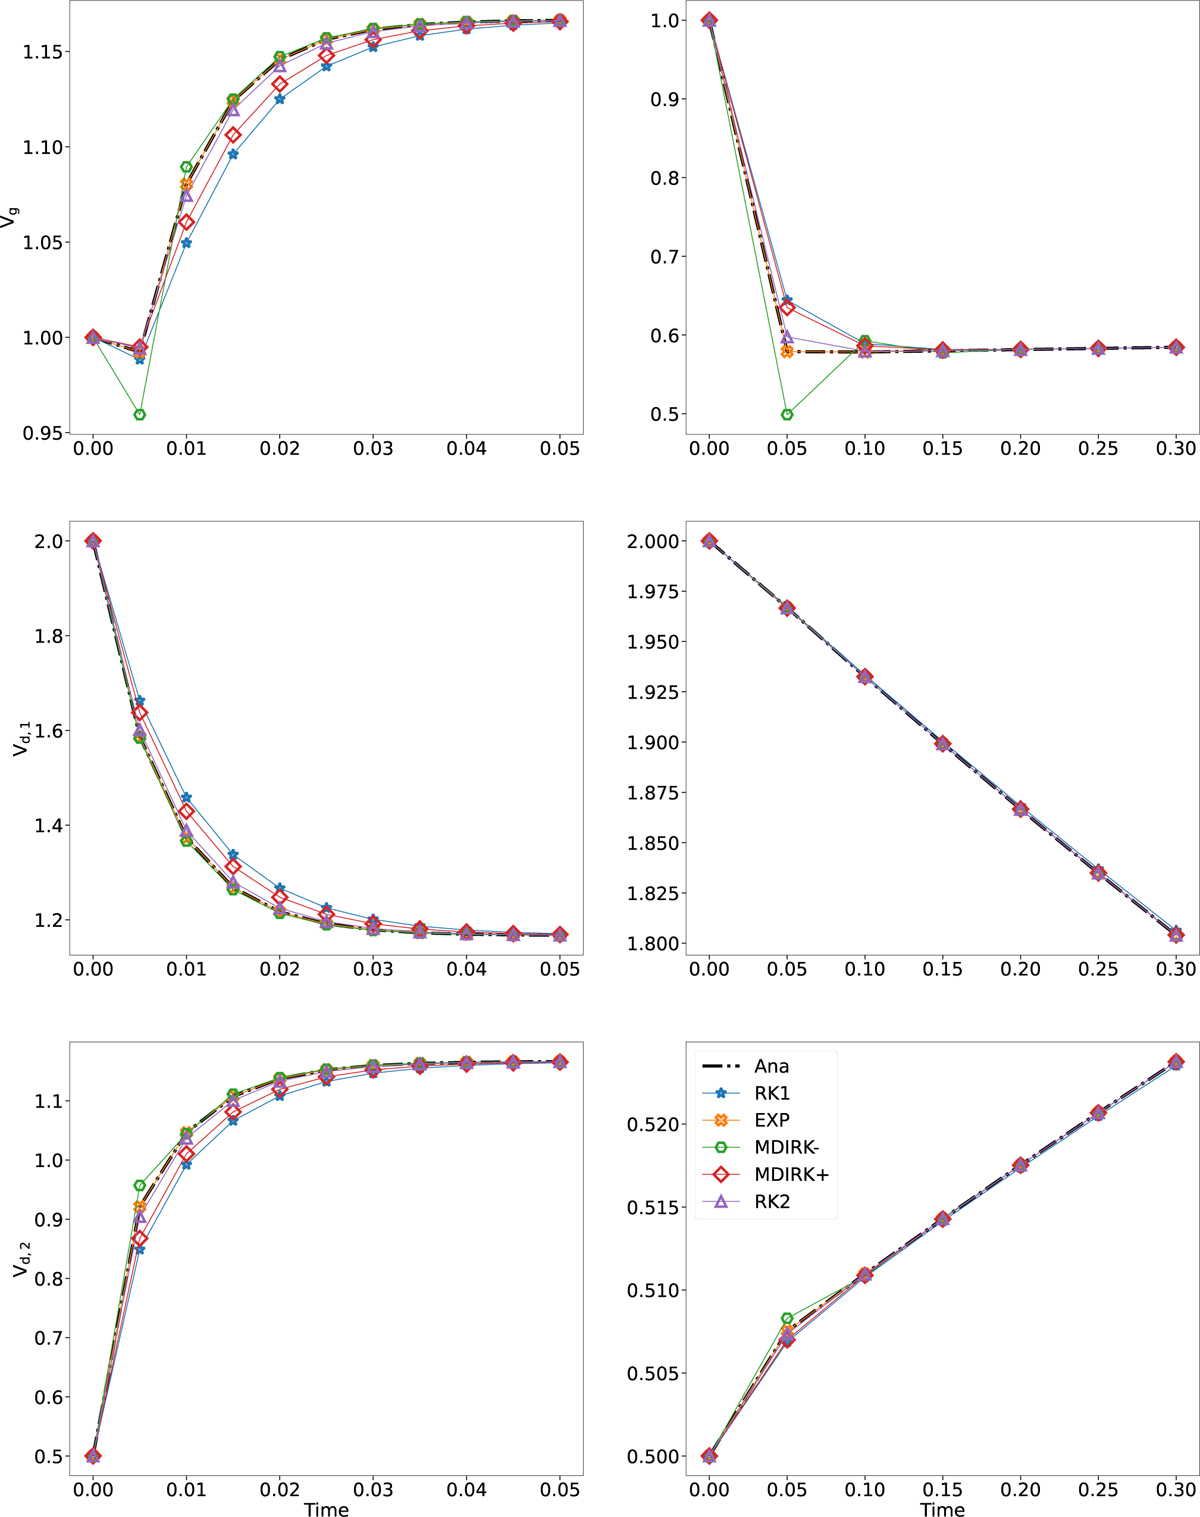
Collisions test. Evolution of the gas and dust velocities (from top to bottom) for tests B and C (left and right columns, respectively). The dot-dashed black line represents the analytical solution. The other lines compare the numerical solutions obtained with the EXP integrator (orange) with other integrators, namely the first-order implicit RK1 (blue), the second-order fully implicit RK2 (purple), the MDIRK method with ![]() (green), and the MDIRK method with
(green), and the MDIRK method with ![]() (red).
(red).
Current usage metrics show cumulative count of Article Views (full-text article views including HTML views, PDF and ePub downloads, according to the available data) and Abstracts Views on Vision4Press platform.
Data correspond to usage on the plateform after 2015. The current usage metrics is available 48-96 hours after online publication and is updated daily on week days.
Initial download of the metrics may take a while.