Fig. 5
Download original image
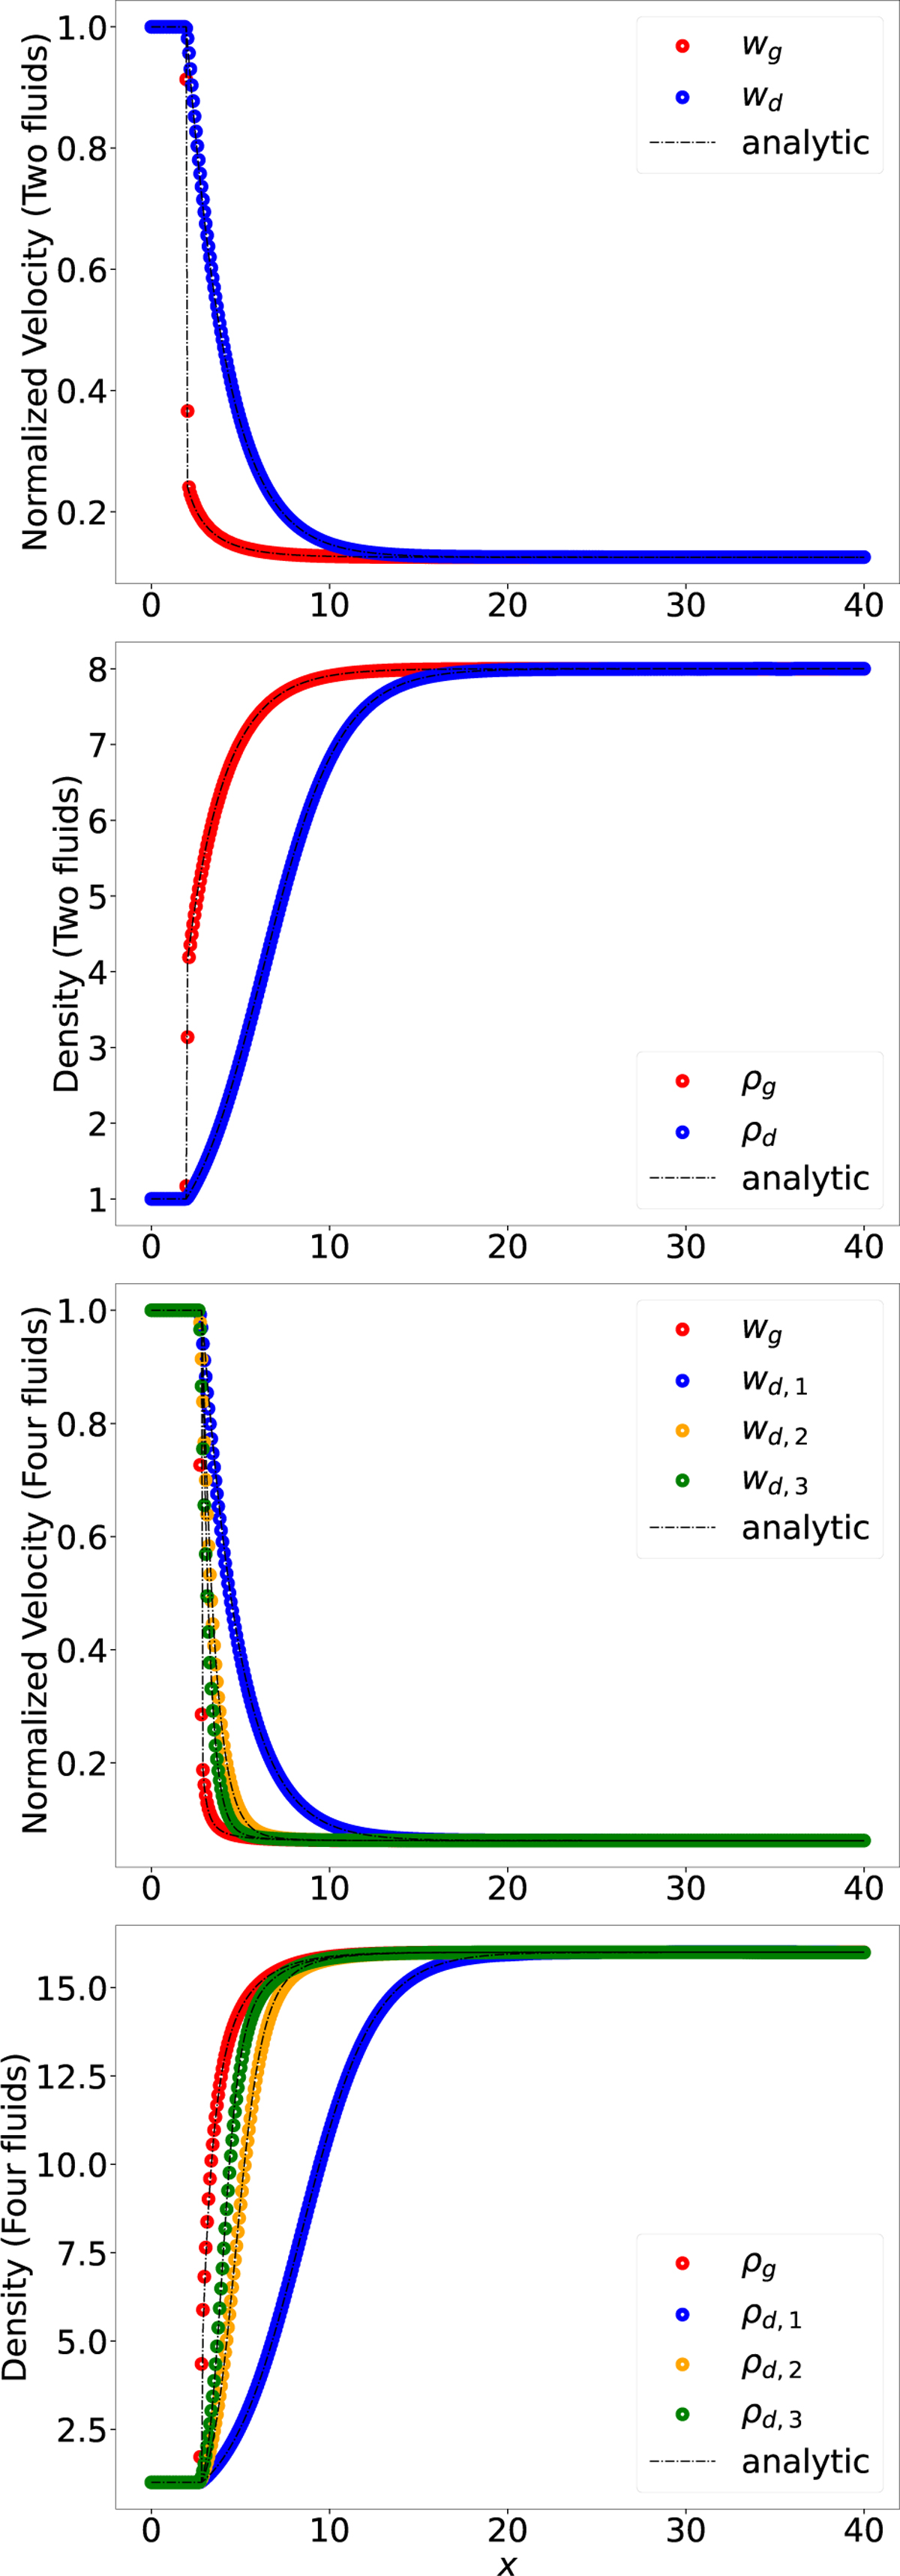
Dustyshock test. Normalised velocities (first and third panels for one- and three-dust fluid(s), respectively) and density (second and fourth panels for one- and three-dust fluid(s), respectively). The dashed lines show the analytical solutions, and the circle markers show the numerical results we obtained with the EXP algorithm. With the EXP solver, the shock is captured within one to two cells.
Current usage metrics show cumulative count of Article Views (full-text article views including HTML views, PDF and ePub downloads, according to the available data) and Abstracts Views on Vision4Press platform.
Data correspond to usage on the plateform after 2015. The current usage metrics is available 48-96 hours after online publication and is updated daily on week days.
Initial download of the metrics may take a while.